This template and idea is about straight forward except the bottom sub-graph. Above 50 it's bullish and below 50 it's bearish. Let me know what ya think.
Hi. What are your complete rules (Stop and profit levels)? If you are using the the Stoch 50 level as a trigger, I would suggest that you use CCI instead (CCI8, CCI50 and CCI500) wich lags less.
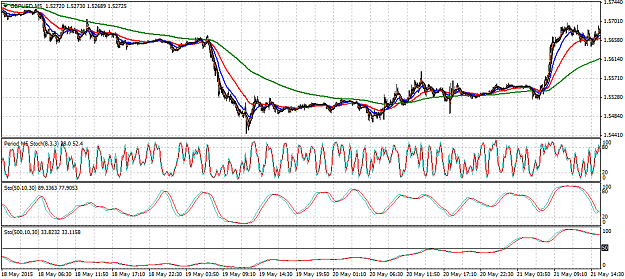
This template and idea is about straight forward except the bottom sub-graph. Above 50 it's bullish and below 50 it's bearish. Let me know what ya think. {file} {image}
Ignored
good system
Only the price on the chart can show the entrance to the deal...
{quote} If that is a wise crack then give my regards to Putin otherwise thanks.
Ignored
My friend, I am a patriot of Ukraine with great pleasure to convey greetings to Putin "on the head with a sledgehammer"
And the system really works well.
Only the price on the chart can show the entrance to the deal...