DislikedIs anyone having consistency using this on the one hour charts?? I am a bit up and down and its not becasue of the trades, its because of the exit timing. Anybody got SL levels and TP's worked out?? or even to the point of how many candles before you check again...I find I am constantly watching the one hour trades and at times exiting to early or late. I reckon 90% of them have been into positive pips and I would be way ahead if had a better exit strategy. Or maybe its bettter to just set a fixed sl and pl and check the success rate??Ignored
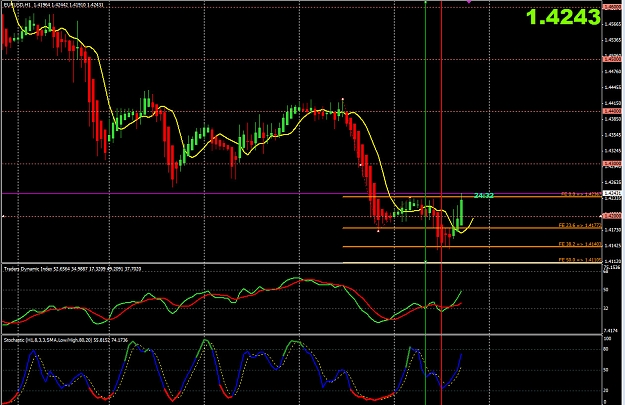
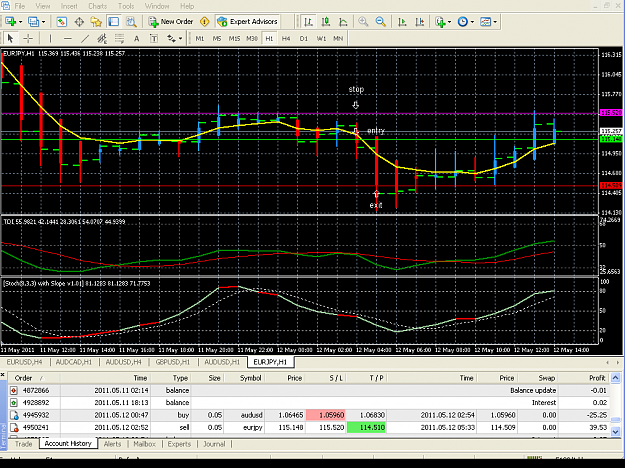
Try fib extensions for exiting and setting profit targets. I took exactly the same trade as you this morning on the EURUSD H1 at the immediate cross of the TDI (marked by the vertical green line). I stayed in the trade (although some minutes later the TDI had turned) due to the following reasons:
1) There was a sustained downtrend previously, prior to consolidation.
2) There was strong resistance in the area of 1.4236.
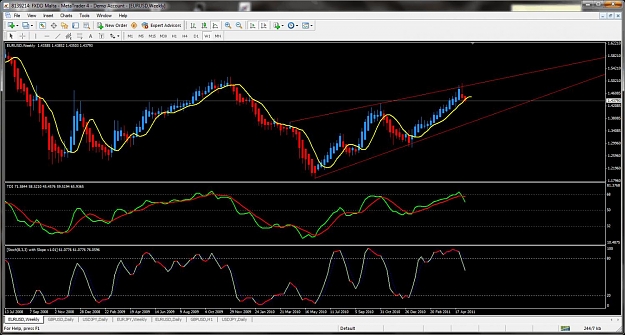
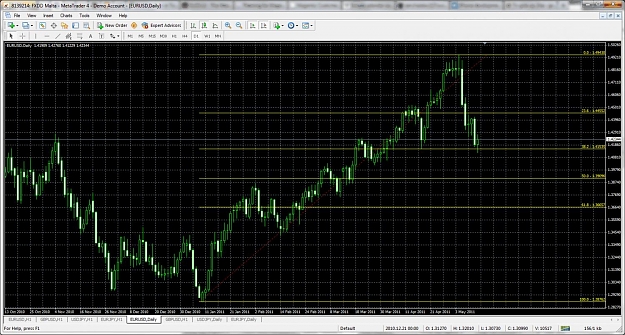
3) Weekly and Daily chart still in downtrend
4) The use of Fib extension allowed me to guage potential targets at 23.6 level 1.4177 and at 38.2 level 1.4140
For me the trade worked out netting 50 pips, I exited at the 38.2 level Fib extension (on candle marked by red vertical line) by montoring the 5M chart and noting the TDI turning in the opposite direction thus signalling the exit. Not strictly by the rule but worked out on this occassion. Still learning and loving it!
Attached Image (click to enlarge)