Posting every day to help order my thoughts and post levels that I'm interested in.
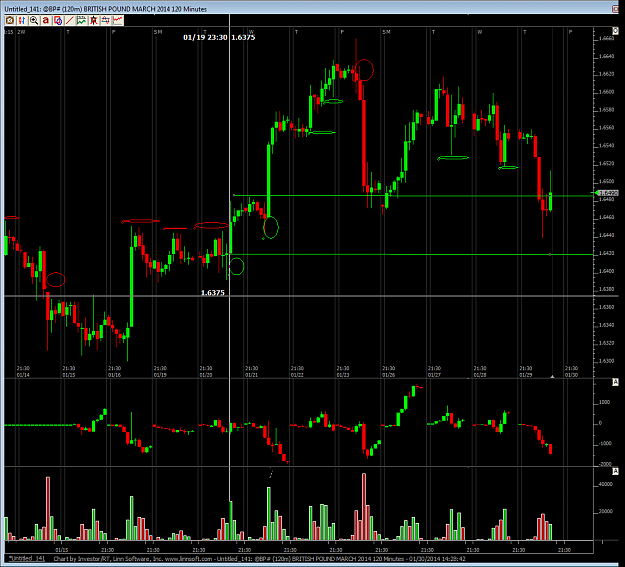
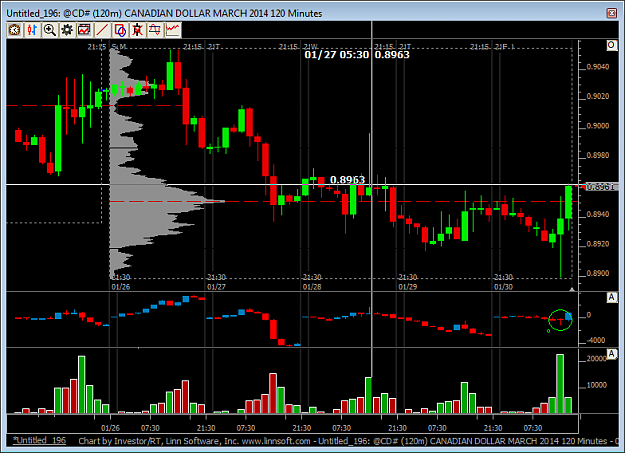
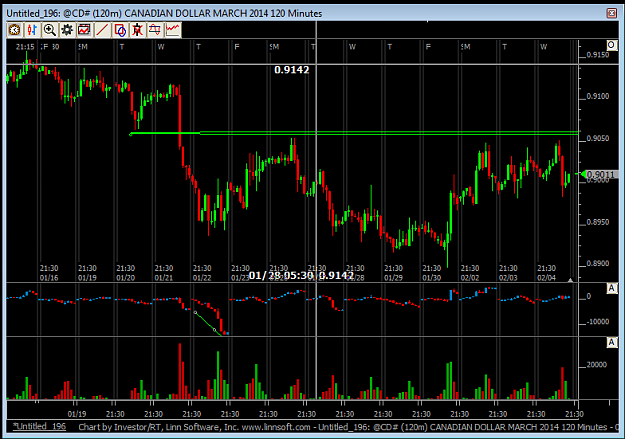
Main trading charts are 2 hour timeframe. Volume is below the price, other indicator is cumulative delta.
Also have charts zoomed out on a longterm 4 hour view that shows market delta as high volume nodes are areas where price has a good chance of price reacting to when it returns.
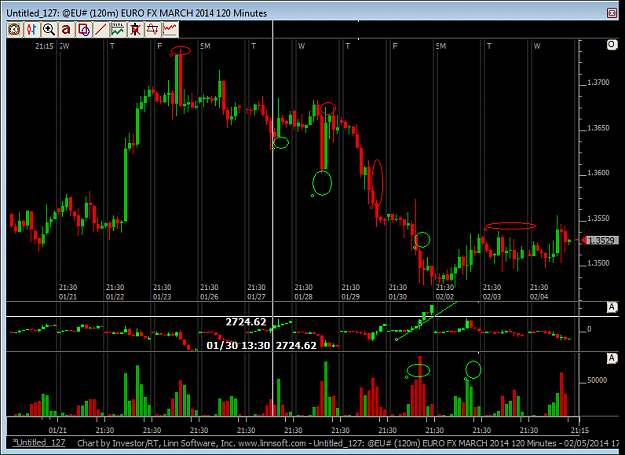
Go back through the chart, look at the other futures contracts (British Pound) and look at what happens when price returns into these big volume bars with the big move in price. You'll see that price always reverses and continues in the same direction until another big volume/price bar occurs.
So my job is not to spot when those big volume bars are going to happen.
Forget it, it's impossible (or try it then let me in on the secret). I've wasted a lot of time trying to do this and I have to accept that unless I can see the order books of all the big banks etc then I really have no idea-there are no clues that I can see. So what I'm after is the reaction to these volume spurts.
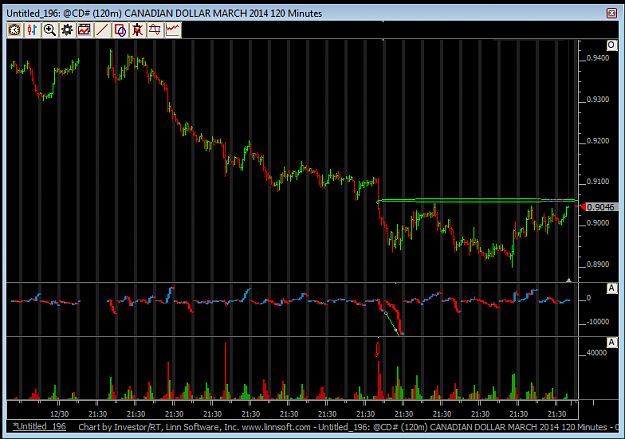
When prices return for the first time into these areas-that's when I trade.
These are easily the most important levels you will see. Ever wondered why price drops on the 30 min chart, it's going great guns lower and then bam, it shoots up 100 points?
It has approached these high volume areas for the first time-sometimes they're a week old, or two days, or two weeks.
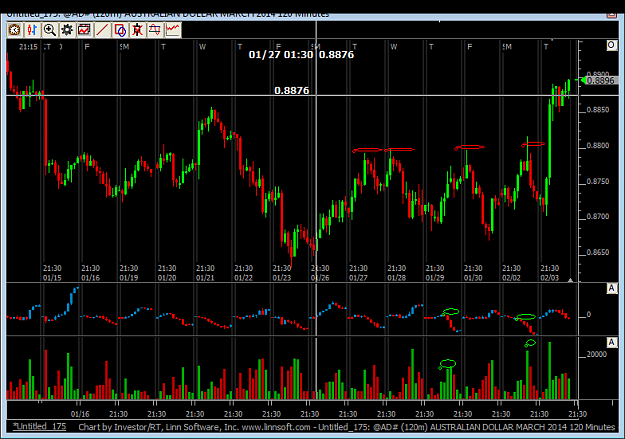
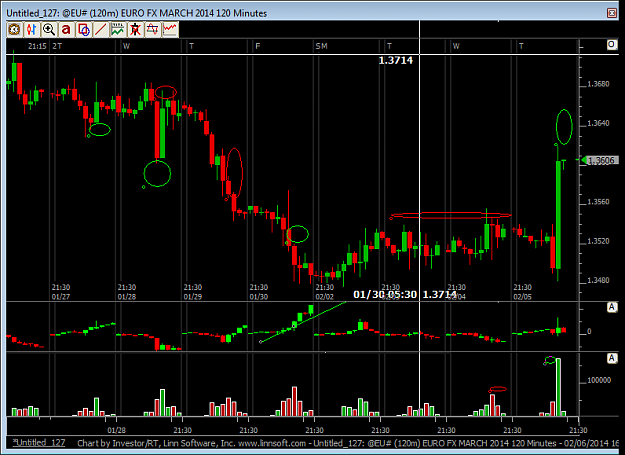
On charts below-green areas show when solid buying took place, red is where solid selling took place. If these areas are circular then they show the start of bars where high volume occurred that also corresponded with sharp price movement.
Look at what happens when price reaches the areas that are marked with either green or red circles. Price will gradually make their way back to these levels and then shoot away again.
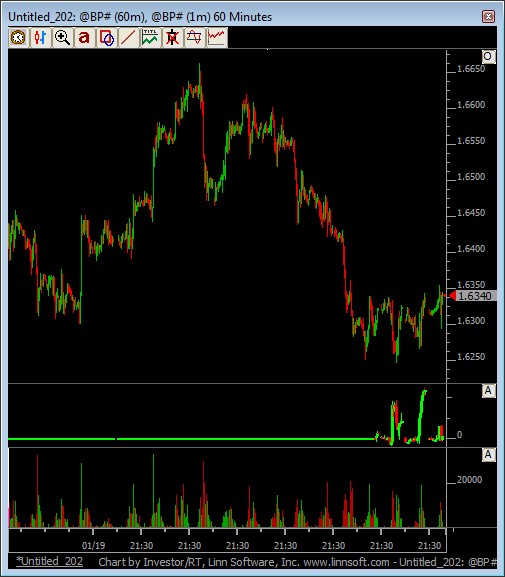
I am currently long the GBP/$ as you can see a nice pinbar in the area that is marked by the two green circles and the two green trend lines.
Note that this is not a perfect trade as this is the second time price has approached this area, meaning there will be less orders in the market to drive prices higher once again.
What do I mean?
There are two types of orders that are driving the market onwards, and one extra kind of trading activity (explained in point 3):
1) orders that never got filled in the direction of the price/volume spurt. These orders are still in the market and will be opened long (if it's a buy volume/price surge) when price returns to these levels.
2) People that were in the market and were short (betting against the volume/price buy surge). They will be opening their positions-initiating a buy, but TO CLOSE THEIR LOSING POSITIONS FOR A SMALL LOSS.
3) If these two types of limit orders are being hit, and then people are buying at the market price directly (as in price is 1.3400. Instead of using a limit order to buy at this price you are entering the market manually at the advertised price by pressing the 'buy' button) then this will propel the market higher.
In the absence of those traders in point 3), prices will rise for a while and then stall.
The long trade I am describing is not perfect as the first 2 scenarios have already been played out when price first returned on 26/27th January. There is a good chance that the market will not go too much higher and will hit resistance at 1.6526.
Why? Look at point 2) again-there was decent buying activity here, and they were all wrong as price plunged lower. So when price retraces back up then they will be looking to exit by selling to CLOSE their positions at a small loss/breakeven. It is this aspect that is not understood by traders as we all think that markets are driven by people opening positions all the time. Closing a position contributes equally to a price move-that's why Support and Resistance works!
Main trading charts are 2 hour timeframe. Volume is below the price, other indicator is cumulative delta.
Also have charts zoomed out on a longterm 4 hour view that shows market delta as high volume nodes are areas where price has a good chance of price reacting to when it returns.
Go back through the chart, look at the other futures contracts (British Pound) and look at what happens when price returns into these big volume bars with the big move in price. You'll see that price always reverses and continues in the same direction until another big volume/price bar occurs.
So my job is not to spot when those big volume bars are going to happen.
Forget it, it's impossible (or try it then let me in on the secret). I've wasted a lot of time trying to do this and I have to accept that unless I can see the order books of all the big banks etc then I really have no idea-there are no clues that I can see. So what I'm after is the reaction to these volume spurts.
When prices return for the first time into these areas-that's when I trade.
These are easily the most important levels you will see. Ever wondered why price drops on the 30 min chart, it's going great guns lower and then bam, it shoots up 100 points?
It has approached these high volume areas for the first time-sometimes they're a week old, or two days, or two weeks.
On charts below-green areas show when solid buying took place, red is where solid selling took place. If these areas are circular then they show the start of bars where high volume occurred that also corresponded with sharp price movement.
Look at what happens when price reaches the areas that are marked with either green or red circles. Price will gradually make their way back to these levels and then shoot away again.
I am currently long the GBP/$ as you can see a nice pinbar in the area that is marked by the two green circles and the two green trend lines.
Note that this is not a perfect trade as this is the second time price has approached this area, meaning there will be less orders in the market to drive prices higher once again.
What do I mean?
There are two types of orders that are driving the market onwards, and one extra kind of trading activity (explained in point 3):
1) orders that never got filled in the direction of the price/volume spurt. These orders are still in the market and will be opened long (if it's a buy volume/price surge) when price returns to these levels.
2) People that were in the market and were short (betting against the volume/price buy surge). They will be opening their positions-initiating a buy, but TO CLOSE THEIR LOSING POSITIONS FOR A SMALL LOSS.
3) If these two types of limit orders are being hit, and then people are buying at the market price directly (as in price is 1.3400. Instead of using a limit order to buy at this price you are entering the market manually at the advertised price by pressing the 'buy' button) then this will propel the market higher.
In the absence of those traders in point 3), prices will rise for a while and then stall.
The long trade I am describing is not perfect as the first 2 scenarios have already been played out when price first returned on 26/27th January. There is a good chance that the market will not go too much higher and will hit resistance at 1.6526.
Why? Look at point 2) again-there was decent buying activity here, and they were all wrong as price plunged lower. So when price retraces back up then they will be looking to exit by selling to CLOSE their positions at a small loss/breakeven. It is this aspect that is not understood by traders as we all think that markets are driven by people opening positions all the time. Closing a position contributes equally to a price move-that's why Support and Resistance works!
Attached Image (click to enlarge)