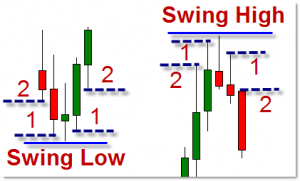
Hello all, as you know Swing high's and swing low's are very very powerful and identify hh,ll and ll,hh on a smaller time scale for optimal trend entries. What I am looking for and I can not seem to find it for the life of me is an indicator that depicts swing high, swing low's as a fractal without drawing lines connecting such as the zig zag.
Is it possible someone can code a fractal swing high swing low indicator for me please, I would be very very grateful.
I am a PA guy so i use these in conjunction with obvious tl's and fib, and piv's.
Also I am looking for a volume indicator that shows the volume numbers over time (without having to hover over the volume bars) on the given time frame such as h1 3250, 4003, 4235 ect showing a visual of the previous bar's volume. Yes I understand this is tick trading and not actual volume, however I understand it should be very very similar no matter what broker since volume data is counted by price tic movements.
Thanks so much.
Know when to hold em, Know when to fold em!