Hi All,
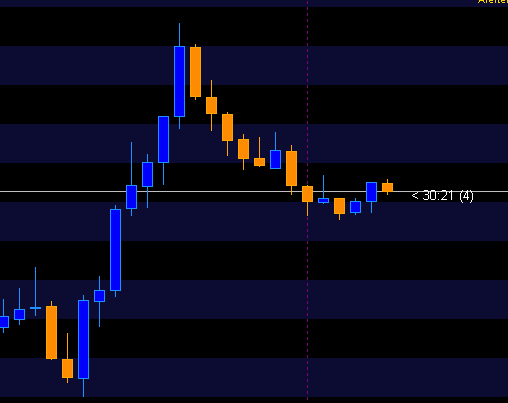
I have an indicator (attached) that draws lines every 50 and 100 price period. I would like to have an indicator that I could add to a chart that would draw alternating colors instead of lines. The below picture is an example of what I would like. I used the "Insert Rectangle" to draw each one by hand.
I would be more than happy to contribute to a Paypal account for the work.
Thanks...Mike G
Attached Image
Attached File(s)