I know this is the vsa dedicated thread but we should be aware of how others play this game.
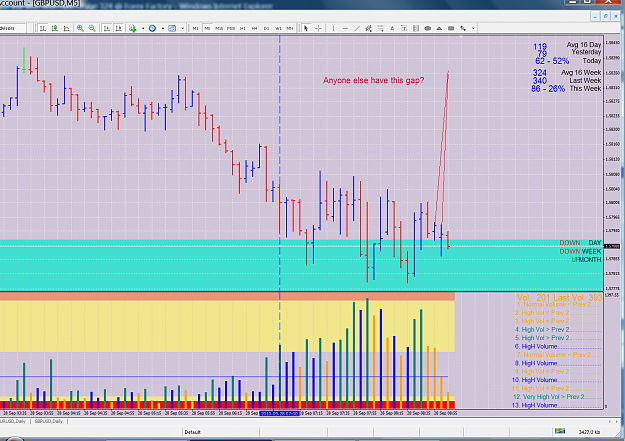
Using the daily chart, take the August high and the September low and apply your fib retracement tool.
Yesterday we experienced resistence to higher prices at the 78.6% level.
Dare I say, there was negative MACD divergence on the 15 and 60 min charts ( lack of desire for higher prices ). And to put the icing on the cake, I now see a head and shoulders pattern on the 60 min chart and we have broken the neckline.
Lots of people trade real money using those 'mumbo jumbo' tactics, so we should never isolate ourselves from the bigger game play.
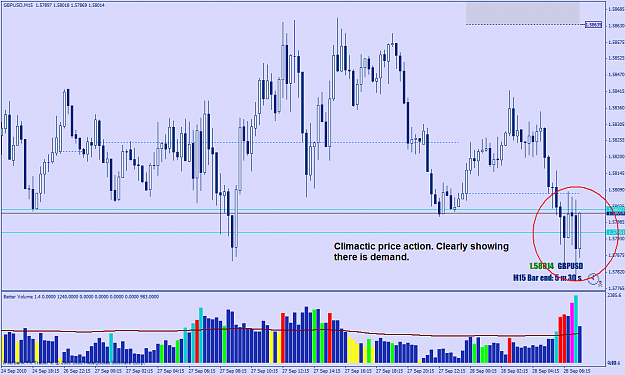
To bring this post back on topic, there was a beautiful no demand on the 15 min directly after the high yersterday, entry 1.5856 with a 20 pip stop.
This vsa stuff works well 'in the right areas'.
Using the daily chart, take the August high and the September low and apply your fib retracement tool.
Yesterday we experienced resistence to higher prices at the 78.6% level.
Dare I say, there was negative MACD divergence on the 15 and 60 min charts ( lack of desire for higher prices ). And to put the icing on the cake, I now see a head and shoulders pattern on the 60 min chart and we have broken the neckline.
Lots of people trade real money using those 'mumbo jumbo' tactics, so we should never isolate ourselves from the bigger game play.
To bring this post back on topic, there was a beautiful no demand on the 15 min directly after the high yersterday, entry 1.5856 with a 20 pip stop.
This vsa stuff works well 'in the right areas'.