Mr Blobby V2 Super Simple 1m strategy – by Roofx
I’m not an expert in trading and I have only been trading for just over a year. However, in this year I have devoted around 12 hours per day, every week day and most Sunday nights to trading. I was a member of a paid teaching service for the first 6 months and have traded a live account on and off over the year. In the first 6 months I put 16 hours a day into trading and studying and researching and have tried many many strategies as well as created many of my own.
I’m here to share my current strategy in the hope that we can discuss its strengths and weaknesses and that some of you may be able to suggest a way to filter out or minimise some of the losing trades. The strategy is the simplest one I have used to date and relies on just one indicator, nothing else. I am using it on cable (GBPUSD) and have not tried it on any other pair. It is as robotic as they come and I imagine it would be very easy to write an EA for this. If anyone is able to do this it would be hugely appreciated. The trading window on this makes for a very long day but if I knew how to add a sound alert to the indicator it would mean I could get on with other things between signals. If anyone knows how to do this, or where to insert the sound alert line in the indicator code it would turn this into a much easier strategy to use.
I would like to thank the friend who introduced me to the BBandStop indicator although they didn’t want to be named here.
Before I explain how it works I’d like to say that on my 1m charts I can’t go back before July to back test this as the indicator is limited in how far back it can go, as are my charts when set to the 1m time scale. So all I have to offer as an idea of the possible success of the method is one month of trade data and approximately 170 trades. I will attach my trading progress spreadsheet along with the indicator and template with this post.
July made 404 pips and I will be trading it through August on small stakes. My target in this whole trading game is 20 pips per average trading day. This is enough to build a very healthy income.
Here’s how it works:
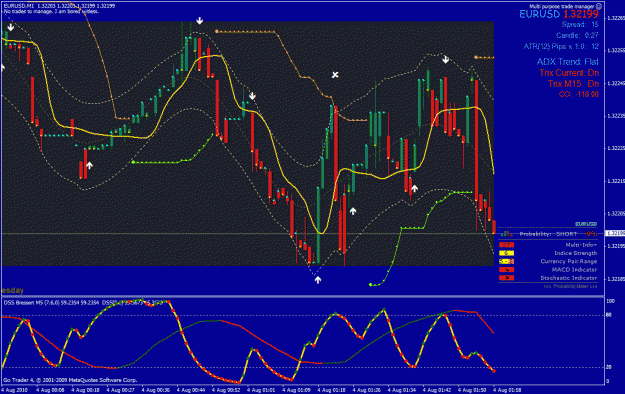
When the BB (shown as a fat red or blue blob) flips above or below and changes colour it is a new trade signal.
You must wait for the 1m candle to close to confirm the signal.
If it flips to the underside (it will change to blue in this case) it is a signal to go long. We stay in the trade until we get a short signal. This is when the blob flips to above and changes to red. Then we close and immediately enter short. We keep doing this for the duration of the trading window. Some of you may only trade a few hours each day. I am currently trading this from 7am GMT to 7.30pm GMT. A long day, I know!
STOP: We have a -45 emergency stop. This is to protect against worst case scenario events such as a big spike. This has never been hit so far in my testing.
Daily Cut-off point: To protect against days where price moves sideways all day we have a -100 pip cut off. This reduces our losses on those occasional terrible ranging days.
We do NOT trade Non Farm Payroll days and if there is a sudden spike of 100+ pips we stop for the day. This is just based on my own experience of how the market can behave after such spikes.
This system should not be judged by its first few trades, but by the pip count at the end of each trading day. By its very nature it usually takes several losses per day, but it’s the bigger moves that it soaks up pips from and makes profit. And the monthly pip count is what matters.
Example of a good day:
http://i940.photobucket.com/albums/a...eofgoodday.jpg
Example of a bad day:
http://i940.photobucket.com/albums/a...leofbadday.jpg
Note: The light grey lines show 5 pip intervals and the heavier grey lines show 25 pip intervals. This makes counting profits or losses very quick.
The Advantages:
This method catches the big moves, sometimes making well over 100 pips in a single trade.
The maximum loss in a single trade I have seen so far is -30. The maximum profit I’ve seen is +132
The system allows many trades per day so it suits those who like to be active and not sit around waiting all day for a trade.
It’s a very simple 1 indicator system and perfect for an EA.
The problems:
At least the way I am trading it at the moment makes for a very long, tiring day.
On sideways periods it takes too many losses
Some sort of filter may be needed to keep us out of some losing trades. If we could even reduce the losses by 25% this system would be improved much further.
August is known as a tough trading month most years but I intend to trade it anyway to see how it goes.
I have attached the template, some screenshots , the BBandStop Indicator and a few other indicators such as ‘sweetspots’ and ‘time to next bar’ so your charts will look like mine.
If anyone can help with the sound alert or even program an EA for this strategy it would help us test different settings and also to test its success on pairs other than cable.
Thanks,
Roofx
I’m not an expert in trading and I have only been trading for just over a year. However, in this year I have devoted around 12 hours per day, every week day and most Sunday nights to trading. I was a member of a paid teaching service for the first 6 months and have traded a live account on and off over the year. In the first 6 months I put 16 hours a day into trading and studying and researching and have tried many many strategies as well as created many of my own.
I’m here to share my current strategy in the hope that we can discuss its strengths and weaknesses and that some of you may be able to suggest a way to filter out or minimise some of the losing trades. The strategy is the simplest one I have used to date and relies on just one indicator, nothing else. I am using it on cable (GBPUSD) and have not tried it on any other pair. It is as robotic as they come and I imagine it would be very easy to write an EA for this. If anyone is able to do this it would be hugely appreciated. The trading window on this makes for a very long day but if I knew how to add a sound alert to the indicator it would mean I could get on with other things between signals. If anyone knows how to do this, or where to insert the sound alert line in the indicator code it would turn this into a much easier strategy to use.
I would like to thank the friend who introduced me to the BBandStop indicator although they didn’t want to be named here.
Before I explain how it works I’d like to say that on my 1m charts I can’t go back before July to back test this as the indicator is limited in how far back it can go, as are my charts when set to the 1m time scale. So all I have to offer as an idea of the possible success of the method is one month of trade data and approximately 170 trades. I will attach my trading progress spreadsheet along with the indicator and template with this post.
July made 404 pips and I will be trading it through August on small stakes. My target in this whole trading game is 20 pips per average trading day. This is enough to build a very healthy income.
Here’s how it works:
When the BB (shown as a fat red or blue blob) flips above or below and changes colour it is a new trade signal.
You must wait for the 1m candle to close to confirm the signal.
If it flips to the underside (it will change to blue in this case) it is a signal to go long. We stay in the trade until we get a short signal. This is when the blob flips to above and changes to red. Then we close and immediately enter short. We keep doing this for the duration of the trading window. Some of you may only trade a few hours each day. I am currently trading this from 7am GMT to 7.30pm GMT. A long day, I know!
STOP: We have a -45 emergency stop. This is to protect against worst case scenario events such as a big spike. This has never been hit so far in my testing.
Daily Cut-off point: To protect against days where price moves sideways all day we have a -100 pip cut off. This reduces our losses on those occasional terrible ranging days.
We do NOT trade Non Farm Payroll days and if there is a sudden spike of 100+ pips we stop for the day. This is just based on my own experience of how the market can behave after such spikes.
This system should not be judged by its first few trades, but by the pip count at the end of each trading day. By its very nature it usually takes several losses per day, but it’s the bigger moves that it soaks up pips from and makes profit. And the monthly pip count is what matters.
Example of a good day:
http://i940.photobucket.com/albums/a...eofgoodday.jpg
Example of a bad day:
http://i940.photobucket.com/albums/a...leofbadday.jpg
Note: The light grey lines show 5 pip intervals and the heavier grey lines show 25 pip intervals. This makes counting profits or losses very quick.
The Advantages:
This method catches the big moves, sometimes making well over 100 pips in a single trade.
The maximum loss in a single trade I have seen so far is -30. The maximum profit I’ve seen is +132
The system allows many trades per day so it suits those who like to be active and not sit around waiting all day for a trade.
It’s a very simple 1 indicator system and perfect for an EA.
The problems:
At least the way I am trading it at the moment makes for a very long, tiring day.
On sideways periods it takes too many losses
Some sort of filter may be needed to keep us out of some losing trades. If we could even reduce the losses by 25% this system would be improved much further.
August is known as a tough trading month most years but I intend to trade it anyway to see how it goes.
I have attached the template, some screenshots , the BBandStop Indicator and a few other indicators such as ‘sweetspots’ and ‘time to next bar’ so your charts will look like mine.
If anyone can help with the sound alert or even program an EA for this strategy it would help us test different settings and also to test its success on pairs other than cable.
Thanks,
Roofx
Attached File(s)