I was going to post this on the thread by EURUSDD, but for some odd reason he has locked it. 
In any event, there are a lot of things going on over there, but one of the great things to come out of it was the similarity principle. The idea is to find zones of dissimilarity that can act as targets for price to go towards. There is apparently a lot of mathematics behind it. The other thread uses two stochs set up to be similar 99% of the time, so that when they become dissonant, a zone is marked on that bar.
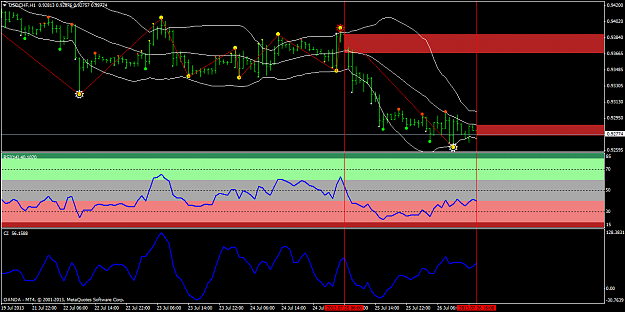
After doing a bit of research on a slow Friday night, I remembered two indicators that were designed to mark the weakening and possible reversal of a trend. This happens when the indicators become dissonant. Their slopes literally are pointing in opposite directions. The are the standard RSI and the Composite Index. The Composite Index was formed by Connie Brown to mark areas of weakness when the RSI could not respond and vice versa. For the sake of discussion I will call it the CI. The formula is in the public domain.
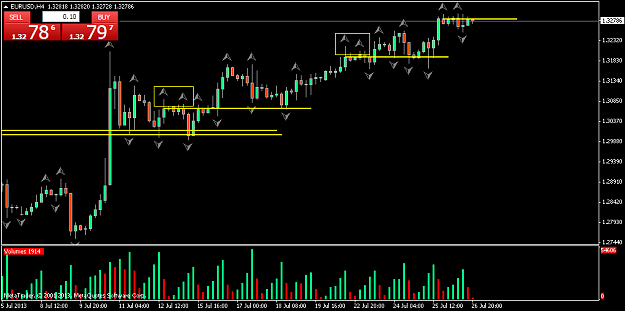
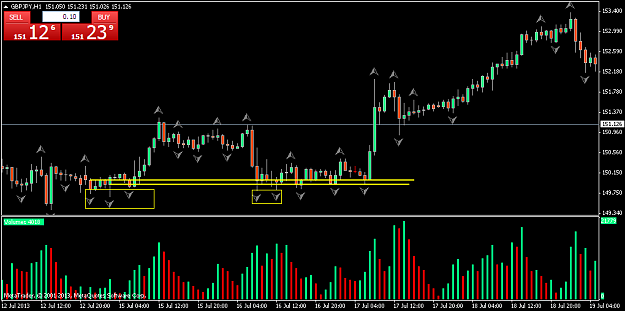
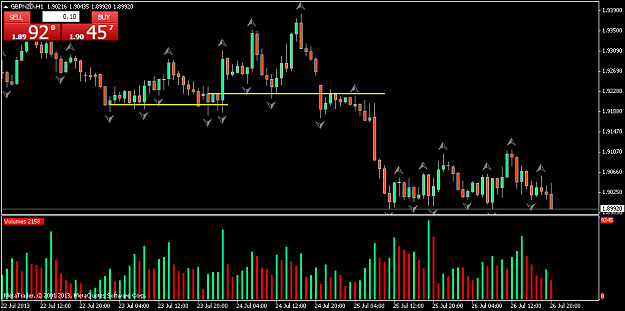
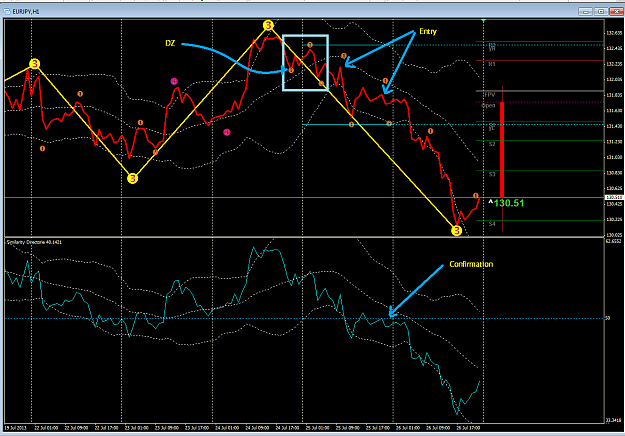
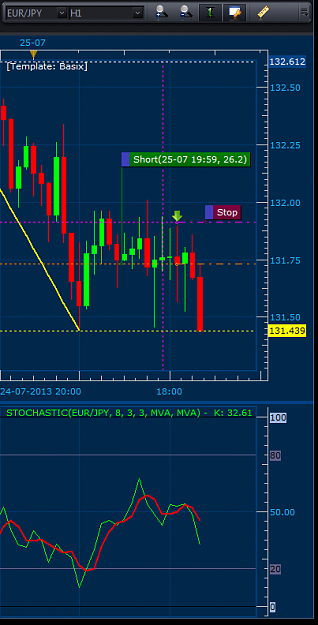
At any rate, I was lucky enough to find a pair that had just formed a dissimilarity bar. I also marked another place where a dissimilarity zone was created on this chart.
Now for the system.
After a DZ is formed, we wait for price to move away from it. It needs to move far enough away for price to breach the BB, a semaphor and zigzag must also have formed. The original similarity thread has gone deep into theory, so I thought I would use a piece of that theory and create a system for everyone to test. The rules are not in stone. So everyone is welcome to contribute. The idea for this thread is to have clear, concise rules. Coders and testers are welcome, of course.
These indicators are similar 99% of the time, so when they become dissonant, it is something to watch. Here is the first chart.
Joe
In any event, there are a lot of things going on over there, but one of the great things to come out of it was the similarity principle. The idea is to find zones of dissimilarity that can act as targets for price to go towards. There is apparently a lot of mathematics behind it. The other thread uses two stochs set up to be similar 99% of the time, so that when they become dissonant, a zone is marked on that bar.
After doing a bit of research on a slow Friday night, I remembered two indicators that were designed to mark the weakening and possible reversal of a trend. This happens when the indicators become dissonant. Their slopes literally are pointing in opposite directions. The are the standard RSI and the Composite Index. The Composite Index was formed by Connie Brown to mark areas of weakness when the RSI could not respond and vice versa. For the sake of discussion I will call it the CI. The formula is in the public domain.
At any rate, I was lucky enough to find a pair that had just formed a dissimilarity bar. I also marked another place where a dissimilarity zone was created on this chart.
Now for the system.
After a DZ is formed, we wait for price to move away from it. It needs to move far enough away for price to breach the BB, a semaphor and zigzag must also have formed. The original similarity thread has gone deep into theory, so I thought I would use a piece of that theory and create a system for everyone to test. The rules are not in stone. So everyone is welcome to contribute. The idea for this thread is to have clear, concise rules. Coders and testers are welcome, of course.
These indicators are similar 99% of the time, so when they become dissonant, it is something to watch. Here is the first chart.
Joe
Attached Image (click to enlarge)
If you are good at something, never do it for free--Joker