This will be a journal of trades taken off of 1 min. TF. on a gold chart.
No set times for trading just when the chart looks good. I live in Pacific TZ so when I get home and trade Asian session.
The Premise is to trade inline with the Arrows of the High/Low Anchor indicator.
Then we look for a setup where a Dot appears outside the Bubble lines and a PZ box is formed (the boxes and Bubble lines do not repaint, however the Arrows and the Dots do with new highs/lows. Not too much of a problem though).
We take a trade after the formation of each box in our desired direction (sell after orange and buy after blue) No SL no TP we close all trades when we see an opposite coloured box appear with a dot outside the bubbles lines.
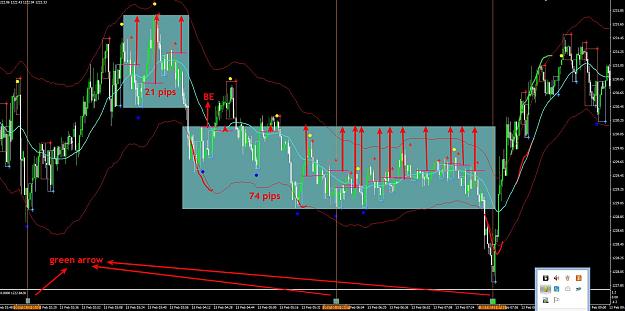
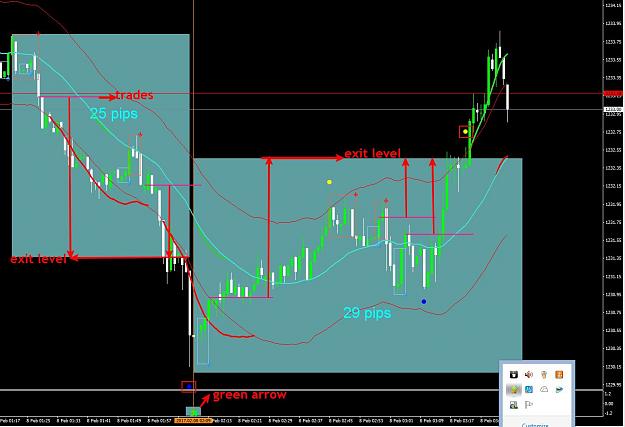
Example of a sell;
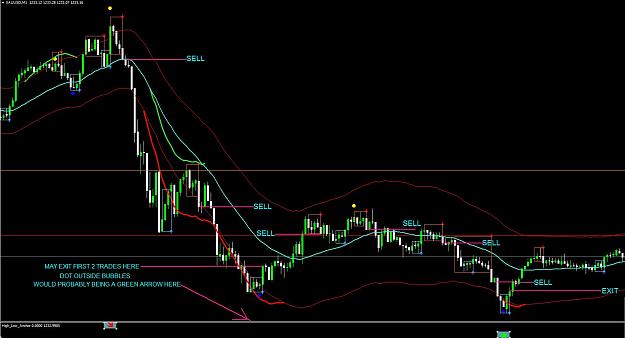
As you can see we started selling at the top with a new red arrow and a yellow dot outside the lines and an orange box. After two consecutive orange boxes we got a blue dot outside the lines and a blue box so we would probably close the two trades, I would presume there was a green arrow also. If there was I would not have taken anymore sells and would see if starting buys would be the way to go. If there wasn't a green arrow we would close our sells and trade the next orange boxes as shown.
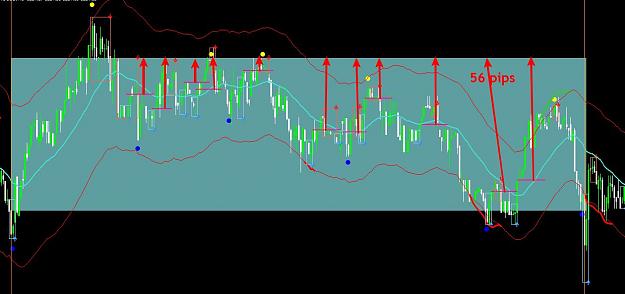
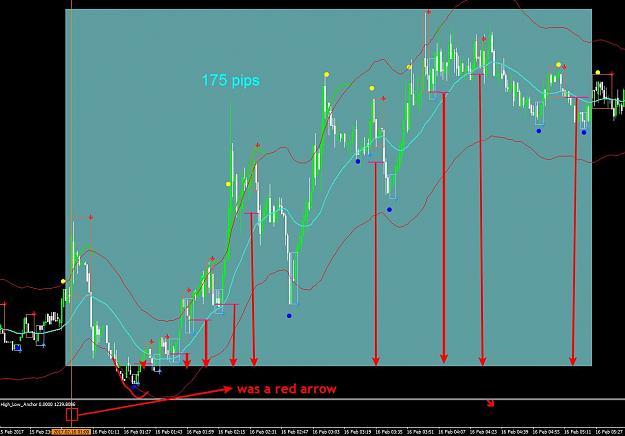
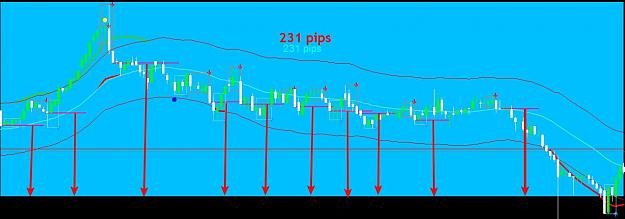
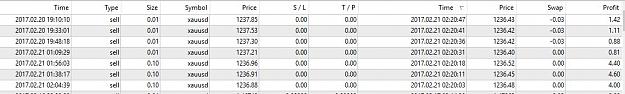
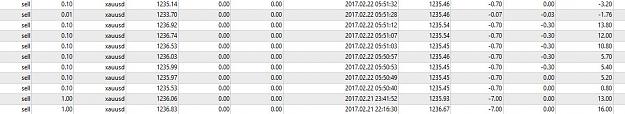
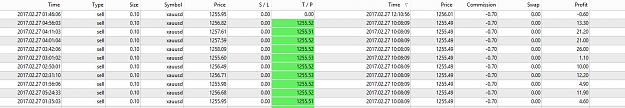
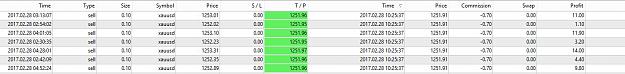
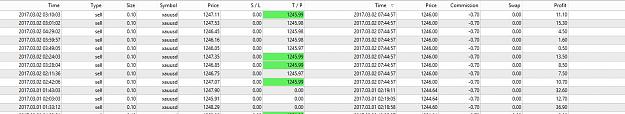
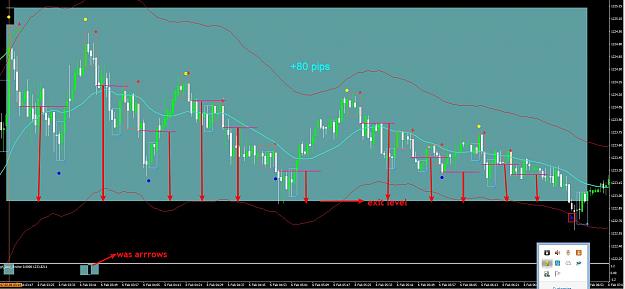
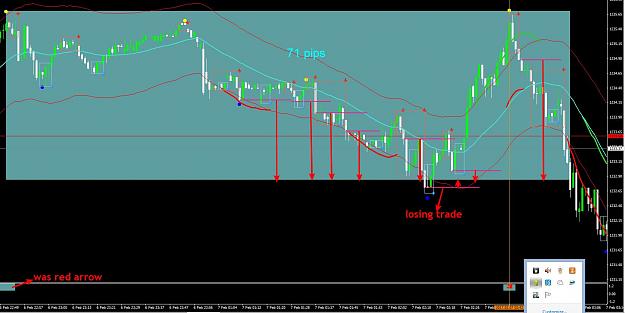
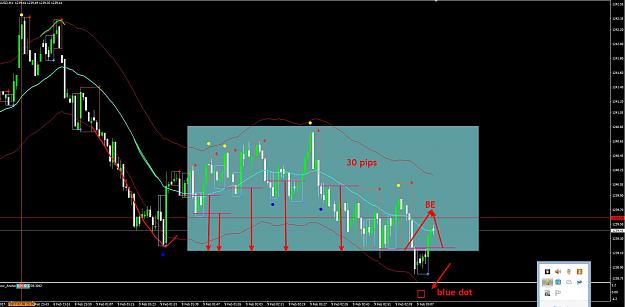
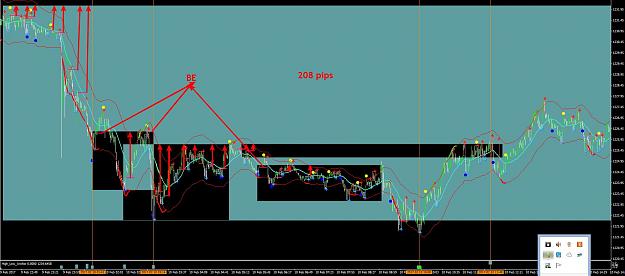
Here are the trades I took last week starting with Sunday (no trades were taken friday Friday)
Lets see where I get with this in the coming weeks.
PLEASE NOTE I AM ONLY PAPER TRADING THIS...
No set times for trading just when the chart looks good. I live in Pacific TZ so when I get home and trade Asian session.
The Premise is to trade inline with the Arrows of the High/Low Anchor indicator.
Then we look for a setup where a Dot appears outside the Bubble lines and a PZ box is formed (the boxes and Bubble lines do not repaint, however the Arrows and the Dots do with new highs/lows. Not too much of a problem though).
We take a trade after the formation of each box in our desired direction (sell after orange and buy after blue) No SL no TP we close all trades when we see an opposite coloured box appear with a dot outside the bubbles lines.
Example of a sell;
Attached Image (click to enlarge)
As you can see we started selling at the top with a new red arrow and a yellow dot outside the lines and an orange box. After two consecutive orange boxes we got a blue dot outside the lines and a blue box so we would probably close the two trades, I would presume there was a green arrow also. If there was I would not have taken anymore sells and would see if starting buys would be the way to go. If there wasn't a green arrow we would close our sells and trade the next orange boxes as shown.
Here are the trades I took last week starting with Sunday (no trades were taken friday Friday)
Attached Image (click to enlarge)
Attached Image (click to enlarge)
Attached Image (click to enlarge)
Attached Image (click to enlarge)
Attached Image (click to enlarge)
Lets see where I get with this in the coming weeks.
PLEASE NOTE I AM ONLY PAPER TRADING THIS...