Good Morning Forex Traders
I just heard by listening to CNBC now that the Press Conference this morning is called for around 11:15 AM EST.
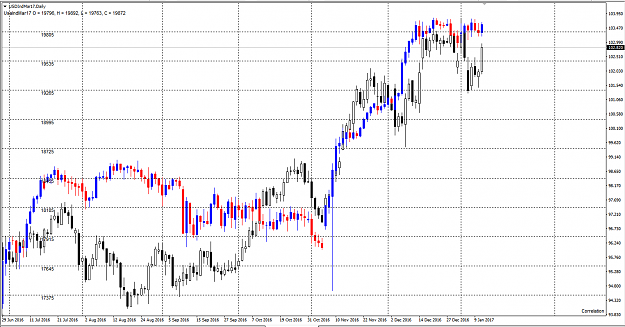
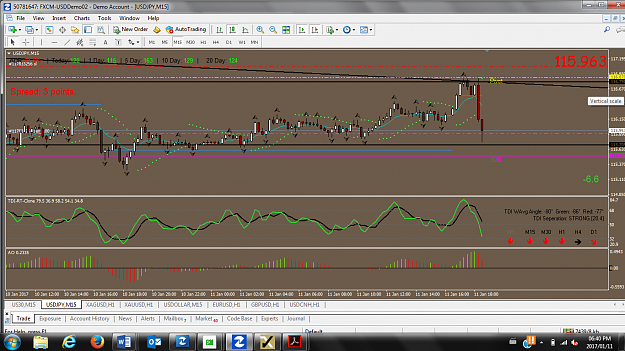
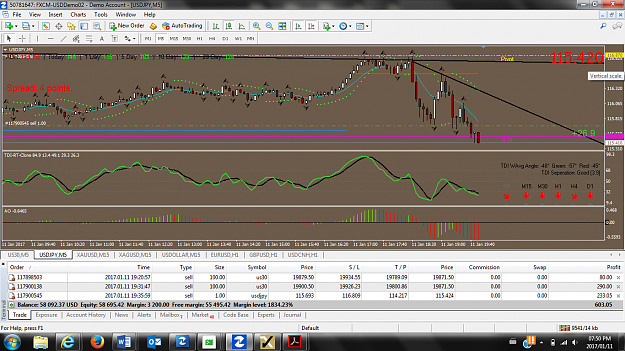
Now to my first topic this morning. I am asking those that have the knowledge from the technical side to share your input here on the following currency pair , USD/JPY and the following chart.
http://www.forexfactory.com/attachme...3&d=1484074759
Last night as I said that I would I went SHORT 2 positions of 100 units of USD/JPY.
My first position was opened at 116.052 and I entered it at 8:09 PM and I put on my second position opened at 116.053 at 9:10 PM.
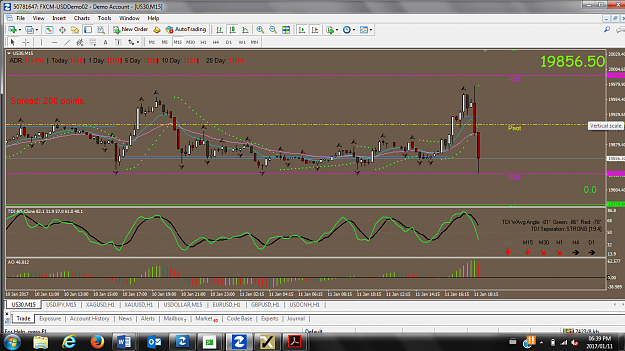
Look at the 5 Minute Chart from Finviz of USD/JPY
http://finviz.com/forex_charts.ashx?t=USDJPY&tf=m5
I put on my second position because the USD/JPY came down below 116.00 and then went up again over 116.00 so now I have 2 open positions.
I put my Limit Out on my two open positions at 115.481 and then I put my second Limit Out at 115.696.
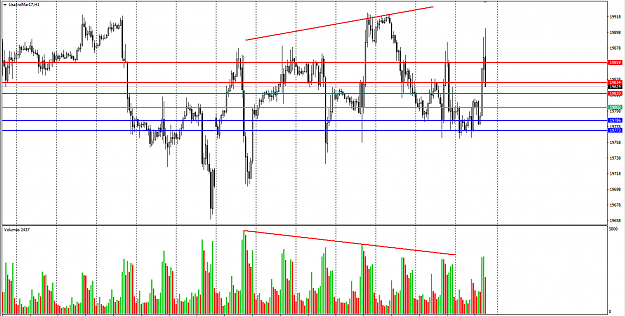
Look at the excellent Chart of USD/JPY and see where Support One is placed and where Support Two is placed. It is where I have my Limit Out.
However I put my Limit Out on without looking at this USD/JPY Chart.
If I had been aware of where the two supports were I most likely would of placed my both Limit Out's at 115.75 and 115.80 locking in $250 US Dollars while I was asleep.
I am sharing all this information so that I can have everyone understand that using the Technical Indicators are a very important part of Forex Trading however it is just one part of it. I would appreciate comments and your views of what I have just stated so we can go further into this important subject.
Thank you for your cooperation.
Benjaminis
I just heard by listening to CNBC now that the Press Conference this morning is called for around 11:15 AM EST.
Now to my first topic this morning. I am asking those that have the knowledge from the technical side to share your input here on the following currency pair , USD/JPY and the following chart.
http://www.forexfactory.com/attachme...3&d=1484074759
Last night as I said that I would I went SHORT 2 positions of 100 units of USD/JPY.
My first position was opened at 116.052 and I entered it at 8:09 PM and I put on my second position opened at 116.053 at 9:10 PM.
Look at the 5 Minute Chart from Finviz of USD/JPY
http://finviz.com/forex_charts.ashx?t=USDJPY&tf=m5
I put on my second position because the USD/JPY came down below 116.00 and then went up again over 116.00 so now I have 2 open positions.
I put my Limit Out on my two open positions at 115.481 and then I put my second Limit Out at 115.696.
Look at the excellent Chart of USD/JPY and see where Support One is placed and where Support Two is placed. It is where I have my Limit Out.
However I put my Limit Out on without looking at this USD/JPY Chart.
If I had been aware of where the two supports were I most likely would of placed my both Limit Out's at 115.75 and 115.80 locking in $250 US Dollars while I was asleep.
I am sharing all this information so that I can have everyone understand that using the Technical Indicators are a very important part of Forex Trading however it is just one part of it. I would appreciate comments and your views of what I have just stated so we can go further into this important subject.
Thank you for your cooperation.
Benjaminis
2