- This strategy will definitely help you to understand price action.
- This strategy will also help you to trade with the trend.
TOOLS/INDICATORS REQUIRED
Bollinger Bands :- Default Settings (20,0,2)
EMA: 100 SHIFT 0 CLOSE
TDI: Default Setting as per Indicator (to confirm setup and overbought/oversold conditions).
Time Frame: 1H, 4H or Daily
IF YOU'RE NEW TO FOREX AND HAVE SMALL ACCOUNT, USE THIS STRATEGY ON 4H CHART.
ALTERNATIVE TO TDI:
RSI : 5 or 7
STOCHASTICS: 5,3,3
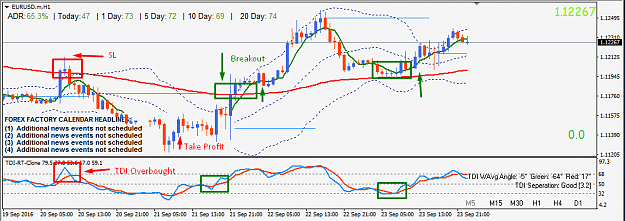
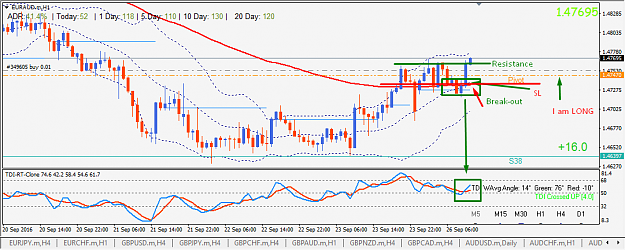
GO LONG
When PRICE IS ABOVE EMA100 and/or bounces off EMA100 we look for all BUY entries. Price Should not be overbought on TDI, RSI or Stochastic or should not be near upper level of bollinger band.
Ideally Price will be near middle line or lower band of Bollinger Bands and just above EMA100. Or it will be a break-out (change in trend from SHORT to LONG). Or TDI is crossing up (blue line is crossing red line).
STOP LOSS: Fixed 20-30 PIPS on low spread pairs (EURUSD, GBPUSD etc), 5 PIPS BELOW EMA100 (If entry is near to EMA) or Previous Low. IF STOP LOSS IS NOT NEAR T
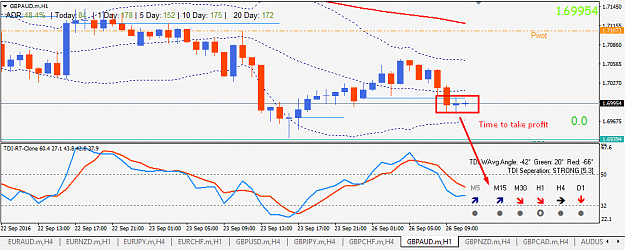
TAKE PROFIT: When prices touches upper band of Bollinger Bands, you can take off your position. Ideally I take off when TDI starts to cross down.
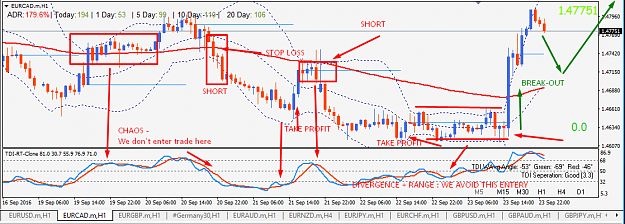
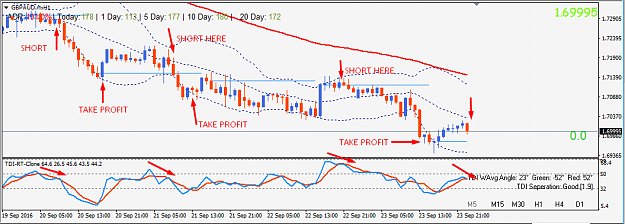
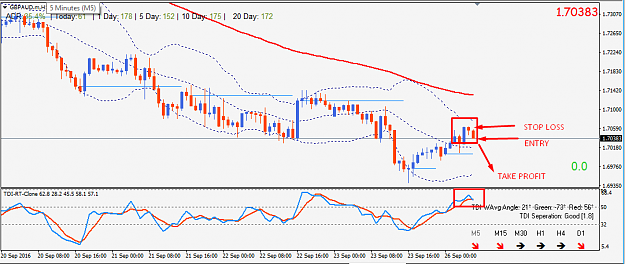
GO SHORT
When PRICE IS BELOW EMA100, we look for all SHORT entries. Price should not be oversold on TDI, RSI or Stochastic. Ideally price will below EMA100 and TDI will be crossing down. RSI, Stochastic or TDI will be near or in overbought conditions. Or Price will be rejected at EMA100 or break below EMA100.
STOP LOSS: Like buy orders, stop loss should be fixed to 20-30 pips OR EMA100 (if price is near EMA100) OR Just Previous High Candle.
TAKE PROFIT: Price hits lower band of Bollinger Bands or when TDI enters in overbought territory.
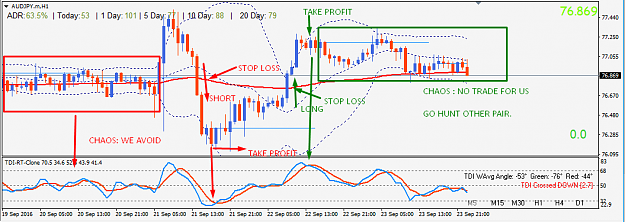
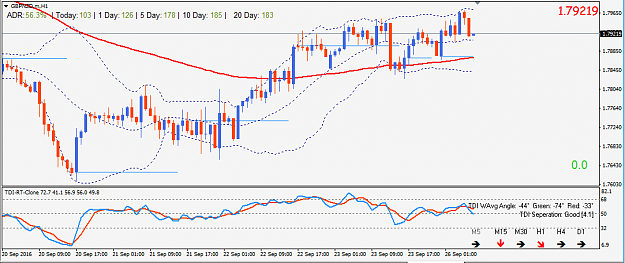
AVOID THE CHAOS // DON'T TRADE IN CHAOS
- See examples. When market is choppy, we don't enter any trade.
- As a new trader, you should also avoid major news events like non-farm payroll, interest rate decisions.
- When Bollinger Band Forms NECKLINE
- When price is all over the EMA100. See AUDJPY example on left side on chart. Price is crossing between EMA100 OR PRICE IS CHALLENGING EMA100 AGAIN & AGAIN. WAIT FOR CLEAR SIGNAL. BREAK-OUT, BOUNCE OR REJECTION TO ENTER TRADE ELSE AVOID 100%
Attachments: TDI Indicator + Template in .Zip File
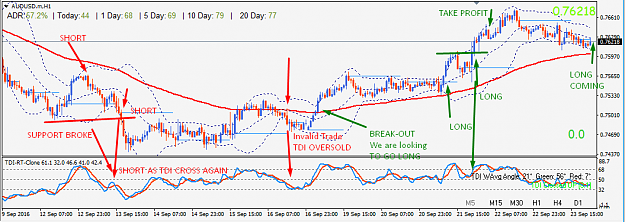
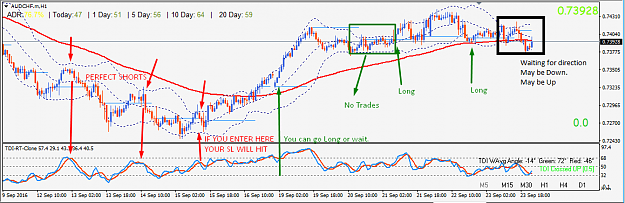
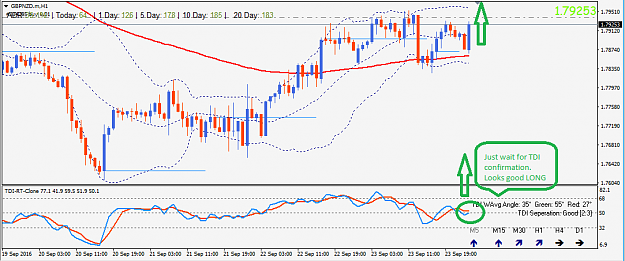
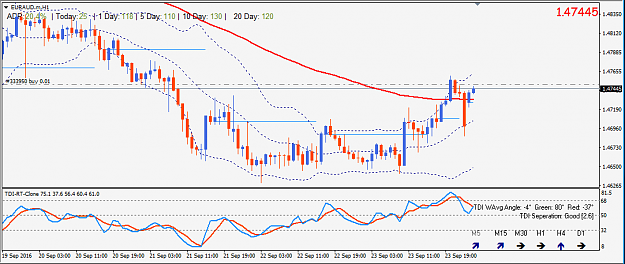
EXAMPLES
ALL GREEN BOXES ARE POTENTIAL BUY ENTRIES AND ALL RED BOXES ARE POTENTIAL SELL ENTRIES.