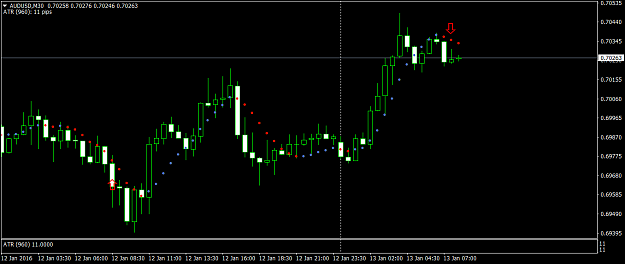
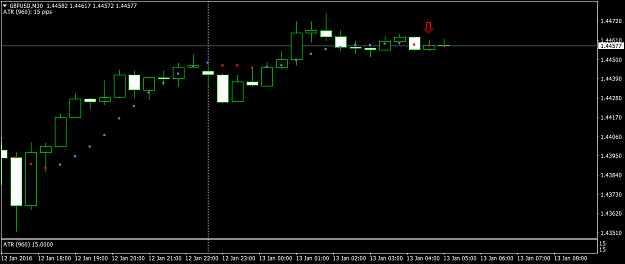
The following diagram represents an issue which I think is indicative of the danger of using the last swing high or low as a Stop Loss point and that is why personally I am against that method of setting stop losses.
The diagram indicates a potential exhaustion of the buying pressure nevertheless that was the first pullback on the chart and it triggered a buy. I would like to hear others thoughts on this issue.
The diagram indicates a potential exhaustion of the buying pressure nevertheless that was the first pullback on the chart and it triggered a buy. I would like to hear others thoughts on this issue.
Attached Image