How To Systematically Dissect Your Trading Strategy
The Edgewonk Custom Stats are the most powerful tool ever to be used in a professional trading journal why? Because you can use them in any way you want and combine them with the already powerful Edgewonk evaluation tools no stone will be left unturned when it comes to analyzing your trading strategy and performance.
Here are some usage examples to spark your creativity after all, being a lab rat and having fun researching is imperative to trading success.
1. Timeframe
Almost every trader in the beginning of his trading career is overly concerned with the granularity of the markets. Should I trade 5 minute charts or daily charts?
It comes down to personal preferences and the time available, really. But maybe you have a setup that you trade both for long term plays and when day trading.
It will surely be very interesting to know on which timeframe you turn the most profit versus time invested because after all, thats why almost everyone starts trading in the first place: More freedom.
2. Session
Volatility and liquidity constantly change when new information or money enters and leaves the market. Many Forex strategies that work during the Asian session will have trouble during The London & New York crossover for example.
It pays off to know during which times your strategy performs best and then focus on those sessions exclusively. This makes your trading more time-effective and more cost-effective.
3. Hour Of The Day
Edgewonk tracks and analyses your performance in relation to holding times of your trades. That way you can easily see whether you are holding your losers longer than your winners, a common beginner mistake.
If you have a strategy which, for example, opens and/or closes trades at the close of the hourly bar, you could track which hour performs best for you this is a deeper way of analysing sessions, as described in the previous point.
4. Big Round Number / Quality Of Support And Resistance Levels
If, for example, you trade a break and retest strategy, you could track if a big round number (price levels ending with .00) stops your trades from reaching the take profit target or whether it does not influence your performance.
You could also track how many touches a support/resistance level took before you set your trade. That being said, you can of course also incorporate this information into your setup itself just name it 2nd retest, 3rd retest, etc.
5. Trailing Stop & Any Other Trade Management Strategy
Almost no one trades the Set & Forget approach, mostly because you can do a lot of good with (professional) trade management sadly, most traders dont and abuse the term trade management to make impulsive in-trade decisions.
If, for example, you want to know how your 5 EMA trailing stop strategy performs, simply create a stat called Trailing Stop 5 EMA and you can then filter all the trades where you used that strategy to evaluate the specific performance.
In combination with the Edgewonk trade management sheet you will even see whether you would have made more profits if you would have let the trade run instead of trailing your stop loss.
6. Indicator Value
We do not advise tracking absolute numbers here as you need a comparable and relatable statistic. Rather try to track something like Stochastics crossed down from above 80, Pivot Level S1 or MACD above zero line, and so on.
This way you can create studies regarding the usefulness of indicators and whether they impact your trading in a positive or negative way.
7. Market Condition
Many traders endorse a top-down approach: they look for trends on higher timeframes and then for entries on lower timeframes in that direction. With the custom statistic you could track whether your trade is going with or against the bigger trend.
You could also track statistics like risk on/risk off, high/low volatility (based on VIX numbers), high/low liquidity or ATR (Average True Range) values; its up to you really and the possibilities are endless.
8. Confluence
The more factors of confluence you stack in your favour in a trade, the higher the probability of turning a profit. You could either use this stat as a pure counter (2 confluence factors, 3 confluence factors, etc.) or you could use combinations of factors and tools, e.g. Fibonacci 50%, Fibonacci 50% + Support/Resistance, Fibonacci 50% + Support/Resistance + MA Cross, etc.
The important thing here is: You will quickly see which confluence factors perform better and which things do not impact your performance.
9. Checklist Style
Using a checklist is highly recommended when trading you could of course also turn the Edgewonk custom statistics into a checklist and only track Yes or No. For example: Price above 200 Ma? Yes.
You can then very clearly see which of the checkpoints on your checklist are the most important regarding your performance, and how your trades perform if you leave out one, two or three of your points.
10. News
News is a topic that is way underrated by most traders in the way that they simply ignore it.
If you do not follow news, and dont want to, at least consider tracking whether and how your trade was influenced by high impact news. There are lots of great economic calendars out there, e.g. the one by Forex Factory.
Of course you could also track the outcome of the news (bearish/bullish, hawkish/dovish) and whether your trade was aligned with or against the news.
11. Psychological Factors
Psychology deeply affects our performance. Why not start tracking whether you had a workout before trading? Or whether you slept well? Or how you feel generally: do you want to trade, do you feel passionate about it, or do you only trade today because you feel like you have to trade? Maybe you feel depressed or overly happy?
It pays off to track these factors and then create rules around them. If you constantly perform worse when you had a few too many drinks the night before, you have two choices: Stop drinking during the week, or dont trade the following day. Its well worth knowing yourself.
Conclusion: Dissecting And Improving Your Trading Strategy Has Never Been So Easy And Efficient
Trading is essentially an information war. You compete with incomplete information against other players with incomplete information. Whoever has the most and best pieces of information, puts them together in an efficient way, and then takes the correct action upon it, will win.
Edgewonk helps you do just that. It will give you the right information and suggestions on how to react to that newly gained knowledge.
The custom statistics are the missing piece in the puzzle of any other trading journal.
The Edgewonk Custom Stats are the most powerful tool ever to be used in a professional trading journal why? Because you can use them in any way you want and combine them with the already powerful Edgewonk evaluation tools no stone will be left unturned when it comes to analyzing your trading strategy and performance.
Here are some usage examples to spark your creativity after all, being a lab rat and having fun researching is imperative to trading success.
1. Timeframe
Almost every trader in the beginning of his trading career is overly concerned with the granularity of the markets. Should I trade 5 minute charts or daily charts?
It comes down to personal preferences and the time available, really. But maybe you have a setup that you trade both for long term plays and when day trading.
It will surely be very interesting to know on which timeframe you turn the most profit versus time invested because after all, thats why almost everyone starts trading in the first place: More freedom.
2. Session
Volatility and liquidity constantly change when new information or money enters and leaves the market. Many Forex strategies that work during the Asian session will have trouble during The London & New York crossover for example.
It pays off to know during which times your strategy performs best and then focus on those sessions exclusively. This makes your trading more time-effective and more cost-effective.
3. Hour Of The Day
Edgewonk tracks and analyses your performance in relation to holding times of your trades. That way you can easily see whether you are holding your losers longer than your winners, a common beginner mistake.
If you have a strategy which, for example, opens and/or closes trades at the close of the hourly bar, you could track which hour performs best for you this is a deeper way of analysing sessions, as described in the previous point.
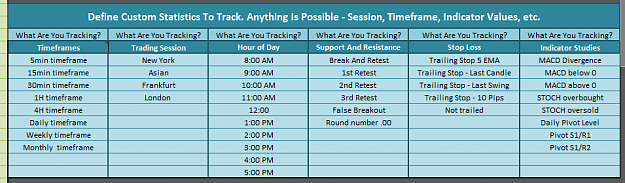
Attached Image (click to enlarge)
4. Big Round Number / Quality Of Support And Resistance Levels
If, for example, you trade a break and retest strategy, you could track if a big round number (price levels ending with .00) stops your trades from reaching the take profit target or whether it does not influence your performance.
You could also track how many touches a support/resistance level took before you set your trade. That being said, you can of course also incorporate this information into your setup itself just name it 2nd retest, 3rd retest, etc.
5. Trailing Stop & Any Other Trade Management Strategy
Almost no one trades the Set & Forget approach, mostly because you can do a lot of good with (professional) trade management sadly, most traders dont and abuse the term trade management to make impulsive in-trade decisions.
If, for example, you want to know how your 5 EMA trailing stop strategy performs, simply create a stat called Trailing Stop 5 EMA and you can then filter all the trades where you used that strategy to evaluate the specific performance.
In combination with the Edgewonk trade management sheet you will even see whether you would have made more profits if you would have let the trade run instead of trailing your stop loss.
6. Indicator Value
We do not advise tracking absolute numbers here as you need a comparable and relatable statistic. Rather try to track something like Stochastics crossed down from above 80, Pivot Level S1 or MACD above zero line, and so on.
This way you can create studies regarding the usefulness of indicators and whether they impact your trading in a positive or negative way.
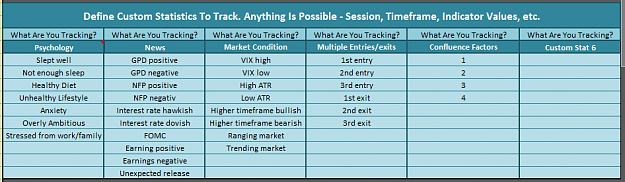
7. Market Condition
Many traders endorse a top-down approach: they look for trends on higher timeframes and then for entries on lower timeframes in that direction. With the custom statistic you could track whether your trade is going with or against the bigger trend.
You could also track statistics like risk on/risk off, high/low volatility (based on VIX numbers), high/low liquidity or ATR (Average True Range) values; its up to you really and the possibilities are endless.
8. Confluence
The more factors of confluence you stack in your favour in a trade, the higher the probability of turning a profit. You could either use this stat as a pure counter (2 confluence factors, 3 confluence factors, etc.) or you could use combinations of factors and tools, e.g. Fibonacci 50%, Fibonacci 50% + Support/Resistance, Fibonacci 50% + Support/Resistance + MA Cross, etc.
The important thing here is: You will quickly see which confluence factors perform better and which things do not impact your performance.
9. Checklist Style
Using a checklist is highly recommended when trading you could of course also turn the Edgewonk custom statistics into a checklist and only track Yes or No. For example: Price above 200 Ma? Yes.
You can then very clearly see which of the checkpoints on your checklist are the most important regarding your performance, and how your trades perform if you leave out one, two or three of your points.
10. News
News is a topic that is way underrated by most traders in the way that they simply ignore it.
If you do not follow news, and dont want to, at least consider tracking whether and how your trade was influenced by high impact news. There are lots of great economic calendars out there, e.g. the one by Forex Factory.
Of course you could also track the outcome of the news (bearish/bullish, hawkish/dovish) and whether your trade was aligned with or against the news.
11. Psychological Factors
Psychology deeply affects our performance. Why not start tracking whether you had a workout before trading? Or whether you slept well? Or how you feel generally: do you want to trade, do you feel passionate about it, or do you only trade today because you feel like you have to trade? Maybe you feel depressed or overly happy?
It pays off to track these factors and then create rules around them. If you constantly perform worse when you had a few too many drinks the night before, you have two choices: Stop drinking during the week, or dont trade the following day. Its well worth knowing yourself.
Attached Image (click to enlarge)
Conclusion: Dissecting And Improving Your Trading Strategy Has Never Been So Easy And Efficient
Trading is essentially an information war. You compete with incomplete information against other players with incomplete information. Whoever has the most and best pieces of information, puts them together in an efficient way, and then takes the correct action upon it, will win.
Edgewonk helps you do just that. It will give you the right information and suggestions on how to react to that newly gained knowledge.
The custom statistics are the missing piece in the puzzle of any other trading journal.