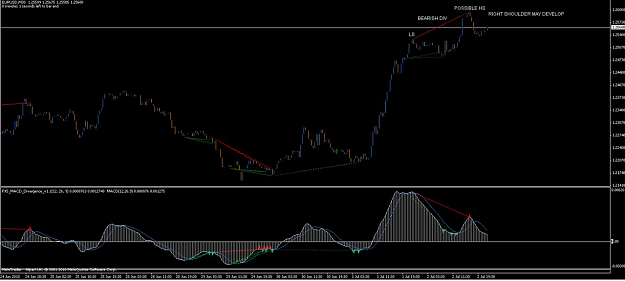
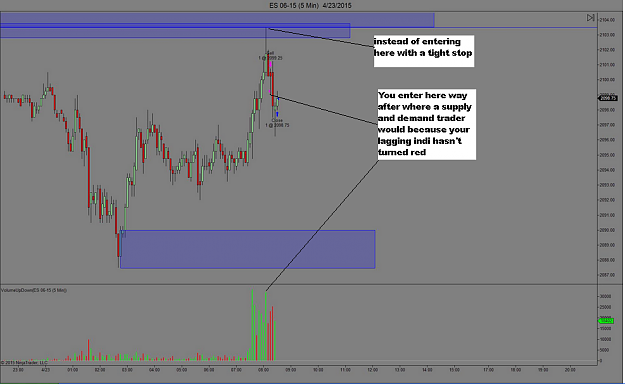
The difference is with RSI and MACD is that divergence shows up on REDS chart which he marked with the red lines, this shows the buying drying up as we approach a supply level and can get in at the best price with yours you have to wait and miss half the move and increase risk.
Also the tail of a J16 pinbar is created by the early buying /selling of an S+D trader.
Also the tail of a J16 pinbar is created by the early buying /selling of an S+D trader.
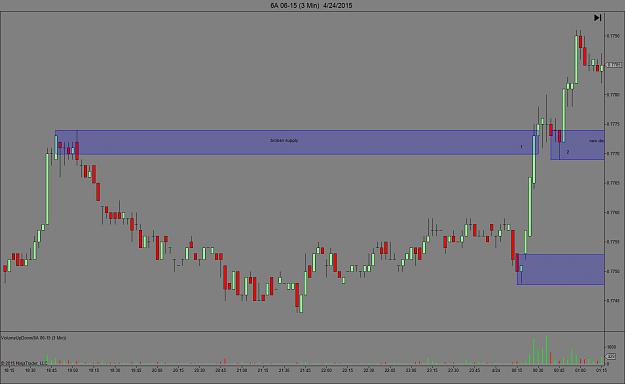
Attached Image (click to enlarge)
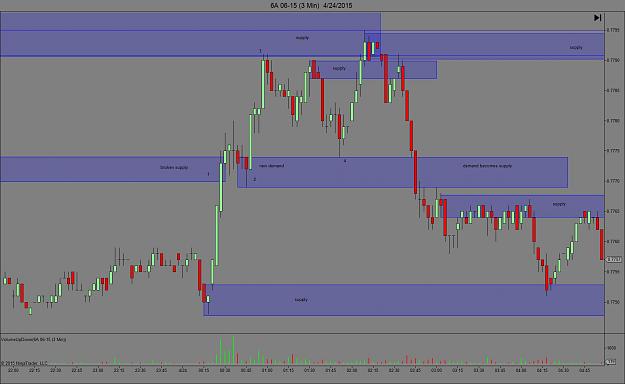
Attached Image (click to enlarge)