This may help keep you out of sideways markets; maybe someone can code it in if you see value.
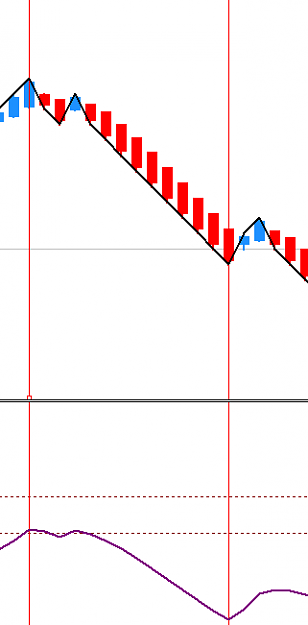
apply RSI(7) to the chart, hide it with color=none, then apply an EMA(7) to the RSI. If the EMA is between 45 and 55, you're probably going sideways. 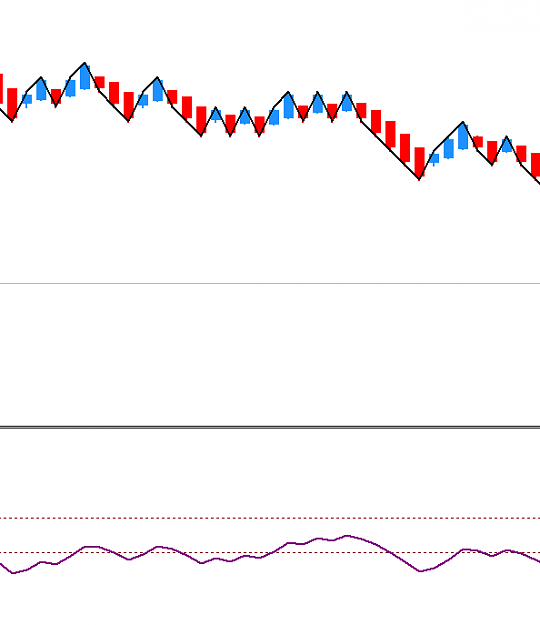
apply RSI(7) to the chart, hide it with color=none, then apply an EMA(7) to the RSI. If the EMA is between 45 and 55, you're probably going sideways.
Attached Image (click to enlarge)