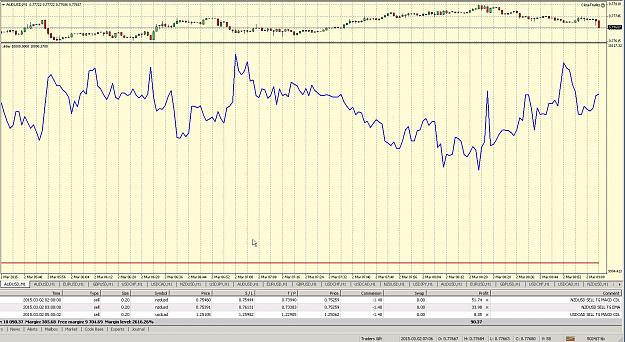
Just a screen shot of the TradersGift Trading Concept equity graph. (see Post #339 & Post #696)
This graph is monitoring the 21 EA's that are enabled. Only 3 are trading at this stage as you will see at the bottom of the graph.
It is looking for a TakeProfit or StopLoss of $150 on a daily basis. At present it is in profit $90. If either target is reached the CloseTrades EA will close all trades and trading will recommence automatically at 00:00:00. The blue line represents the current equity line and the red line represents the starting equity of $10,000. The trade explorer is at the top of this post.
EDIT 3rd March - I've reduced the TakeProfit and StopLoss to $100 to ensure we are able to view the CloseTrades EA in action. Yesterday the EA cycled from about $115 profit to around $75 loss and then at the end of the day to around breakeven. The EA in this situation just resets the StartingEquity to the current equity at 00:00:00.
Attached Image (click to enlarge)
![Click to Enlarge
Name: 2015-03-03 07_12_41-2011421_ GlobalPrime-Demo - Demo Account - [AUDUSD,M1].jpg
Size: 251 KB](/attachment/image/1622557/thumbnail?d=1425367063)