"When nine people agree on something, it’s the tenth man’s responsibility to disagree no matter how improbable the idea." - World War Z movie.
If you look at fundamental analysis and recent trend, there is all the reason to be short EURUSD (I am short myself). Whenever I am in a position, I look at evidence and analysis of why I may be wrong, and why it may be a good time to exit to lock in profits, and possibly reverse the position.
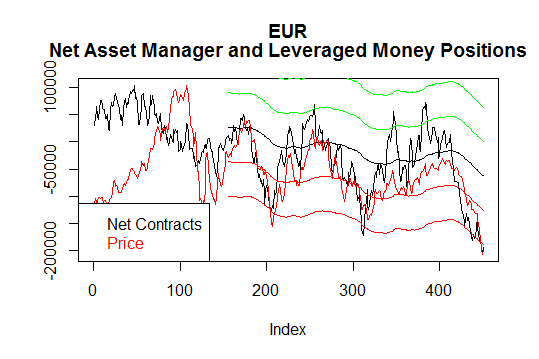
I recently downloaded Commitment of Traders Report (COT) data on EUR futures. If you are not familiar with this, the NFA samples positions from dealers, funds, etc and posts the data weekly. Below is a graph of net asset manager and leveraged money contract positions (black), overlaid with the typical price (O+H+L+C)/4 for the week (red). There are about 450 weeks of data. The green lines are +1, +2 stdev lines from the mean (black line), and the red are -1, -2 stdev. Positions are at an near a 9 YEAR NET SHORT.
As you can see, when these funds are all on one side (near -2 stdev of the mean), price tends to reverse and trend up.
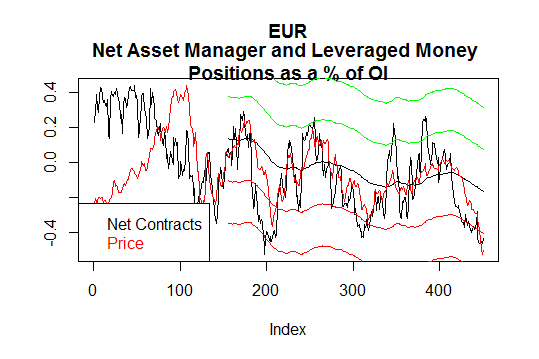
Below is another chart showing the same thing, but as a % of open interest.
Now when everyone is on the same side of the trade, we see it may reverse. I will be closely watching my short EURUSD positions, the Greece news, and USD fundamental news to see any shifts. This may be a time to long.
Again, I'm still short EURUSD and positions are in profit ... but looking for reasons why I may be wrong and its time to get out.
Feel free to post any analysis here contrary to the major trend and fundamental bias of any currency pair ... but back it up with reasons and data (not just pure speculation)!
EZcurrency
If you look at fundamental analysis and recent trend, there is all the reason to be short EURUSD (I am short myself). Whenever I am in a position, I look at evidence and analysis of why I may be wrong, and why it may be a good time to exit to lock in profits, and possibly reverse the position.
I recently downloaded Commitment of Traders Report (COT) data on EUR futures. If you are not familiar with this, the NFA samples positions from dealers, funds, etc and posts the data weekly. Below is a graph of net asset manager and leveraged money contract positions (black), overlaid with the typical price (O+H+L+C)/4 for the week (red). There are about 450 weeks of data. The green lines are +1, +2 stdev lines from the mean (black line), and the red are -1, -2 stdev. Positions are at an near a 9 YEAR NET SHORT.
As you can see, when these funds are all on one side (near -2 stdev of the mean), price tends to reverse and trend up.
Below is another chart showing the same thing, but as a % of open interest.
Now when everyone is on the same side of the trade, we see it may reverse. I will be closely watching my short EURUSD positions, the Greece news, and USD fundamental news to see any shifts. This may be a time to long.
Again, I'm still short EURUSD and positions are in profit ... but looking for reasons why I may be wrong and its time to get out.
Feel free to post any analysis here contrary to the major trend and fundamental bias of any currency pair ... but back it up with reasons and data (not just pure speculation)!
EZcurrency
Attached Images