Disliked{quote} Pls provide the details of initial investment you are looking at to get into this mode of trading........and then how much risk are you willing to take ........not in terms of no. of pips but $ per trades..............lets discuss itIgnored
in this early stage of my approach to this method I have no details so far. It depends on the hard numbers the backtests will show concerning entry and exit. Sorry that I use this post to also write to other traders.
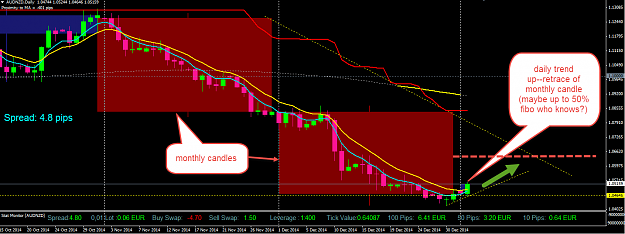
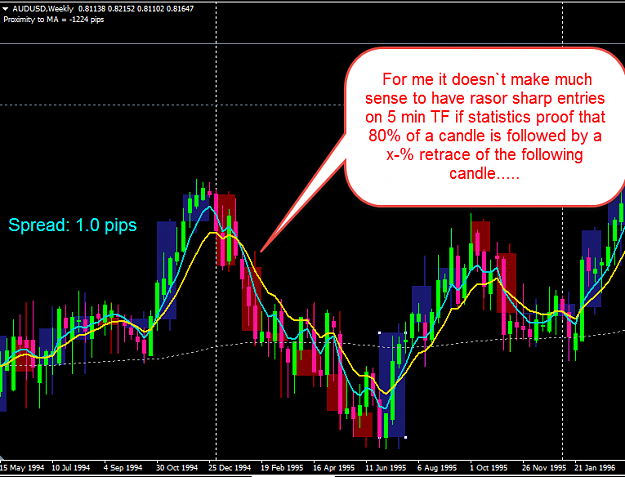
If anyone interested has hard numbers of the monthly and weekly candles I invit him to share.
As I have a fulltime job and only a few hours of time per week any help is appreciated.
All pairs without the exotic ones with spreads of 10 pips and more are in interest.
As the data of each candle contains open, high, low and close there can be derivated
- extent of the candle body
- extent of the wicks
- retrace to previous candle
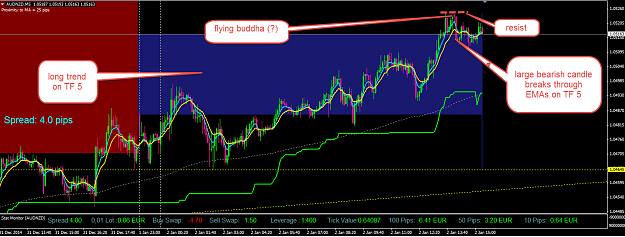
- duration of trends
- duration of rangings
- behaviour at pivot points/-zones
- ??? surely I missed further possible measurements ( I`m no prof in this
I know that proffessional traders/institutions don`t look to charts so much. In fact they calculate probabilities
to get the advantage to their side! So why not acting in similar way?
Look at the screen please. By doing this effort I want to elaminate needless entries in areas where the probability is high that my positions are stopped out. Thus avoiding a lot of lost pips. I want to focuss out these areas there the advantage is on my side with a higher %-chance.
Any thoughts?
Greetings
Attached Image (click to enlarge)
Have a nice day