After show a typical day, I want to show a chart illustrating a lateralized market, where prices are "stuck" in a trading range.
AUDUSD, M30
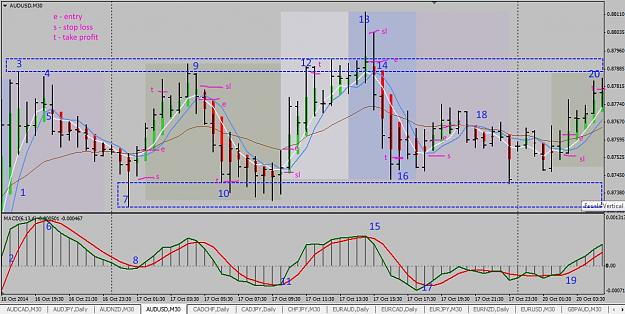
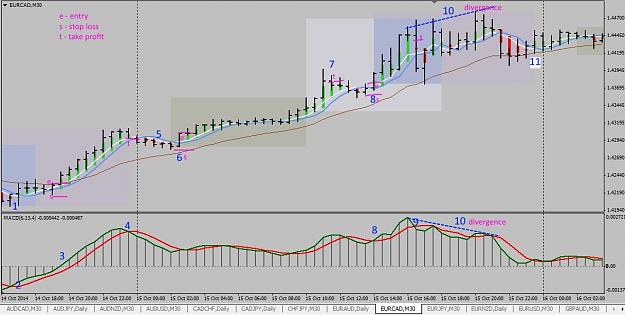
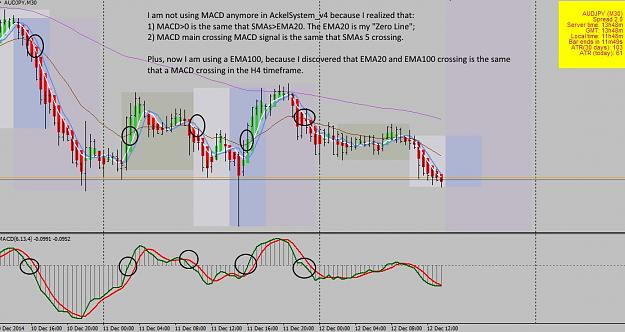
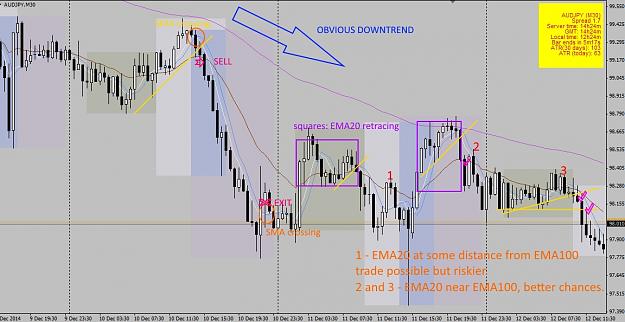
After a rise in prices (1), the prices are above the EMA 20 and MACD> 0 (2), prices begin to respect a level of resistance (3) and (4). Then there is an intersection of SMAS and MACD (6), but until then I do not know if the market is only correcting toward the EMA 20, reversing entirely or only "breathing" before rising from (5). I do not go on selling trade. I prefer to wait to see what happens near the EMA 20. Prices go down slowly but when they arrive at EMA 20, suddenly fall to (7), returning and making a pinbar. Right now my reading is that there was a rejection at that level of resistance then I start to see a side market, with the background or "floor" support indicated in (7) and as resistance or "ceiling" the region indicated in (3) and (4).
Based on this interpretation, my focal points are 1 - EMA 20, 2 the background, to enter buying, and 3 the ceiling, to enter selling. In this situation, when I saw the ceiling I can stop in EMA 20 and probably will not have profit or it will be small, or the price will go down to the support, giving me a more profitable trade.
For this negotiation be a valid model, the EMA 20 must be situated between the two extremes of the trading range. It will be floating in the central region between these two limits, then the distance between these limits and EMA can not be too small. If the track is too narrow (less than 50 points), it is best to stay out of the market and operate other pair. You should wait until the prices come out of this range to re-operate the pair. Fortunately, there are dozens of other currency pairs to negotiate as we await a favorable situation in the pair under analysis.
When it happens crossing the MACD in (8) I buy at the breakout of signal candle (which is the previous candle) and place my stop loss below the signal candle. When the price reaches near the top and begins to retreat I leave the trade.
When prices come in (9) and reverse, this confirms the top of the trading channel. There is a candle that penetrates the resistance area and the next candle is its opposite, setting up a classic sign of reversal. I enter the next candle when it goes up a little bit and then starts to fall, coming below the opening price. There lay my entry with stop loss above the same candle entry. There crossing in SMAs and MACD. 3 candles by the price falls across the center of the channel, where is the EMA 20, without acknowledging it. When it comes in (10) the reverse prices, reaching out to touch the EMA 20 from the channel bottom. However, as there is no crossing of SMAs and MACD, I come not buying. Prices fall back to and several candles are playing in the support region, until one of them shows more strength, just as happens the intersection of SMA and MACD.
I go with a buy order in next candle, at the point where the top of the signal candle is exceeded (breakout). The stop is a little big, but as my target is the top of the channel, it is worth the risk.
The price reaches again the top of the channel (12), but this time he stopped to 'lean' on EMA 20. This may mean that the strength of the channel is already lower than the previous trade. However, as in (12) the price fell, the channel remains valid. Prices go up (13), beyond the limits of the channel, but this is a 'false breakout', then prices plummet again, penetrating again in the channel, which remains valid. Upon returning, the price drew a rejection bar above the region, which shows that from that point there is selling force.
In (14), the bar comes to rise, but quickly drops to its opening paragraph, enabling a sell. The stop loss is placed on top of the entry candle. There is also the intersection of SMA and MACD. Again the bottom of the channel is reached, with excellent profit.
Note that in (16) prices have not fallen as much, and the support is slightly higher than that of the point (10).
Now the London session has closed, but as there is the crossing of the MACD (17) and MAS, and reversal candle, I go shopping again, as prices fell as a little and went back to the entry point, allowing entry with stop loss placed below the entry candle. Prices will even EMA20 and stop. Already there is less volume and volatility, and some candles keeps the price in the center of the channel. Seeing that the trade would not evolve I get out of trade, ending the day.
Generally should not trade in the period between the final hours of the New York session (end of day) and the opening of Tokyo.
The next day, with the crossing of the MACD (19) and SMAS, prices rise to the top of the channel again (20), so when the Tokyo Stock Exchange opens and puts more money in the market.
6 are winning trades, no loser. 1420 points or 142 pips (5 digit broker). On average the profit was 3 times higher than the risk used (average size of stop loss). Results from a simulation, not real account.
AUDUSD, M30
Attached Image (click to enlarge)
After a rise in prices (1), the prices are above the EMA 20 and MACD> 0 (2), prices begin to respect a level of resistance (3) and (4). Then there is an intersection of SMAS and MACD (6), but until then I do not know if the market is only correcting toward the EMA 20, reversing entirely or only "breathing" before rising from (5). I do not go on selling trade. I prefer to wait to see what happens near the EMA 20. Prices go down slowly but when they arrive at EMA 20, suddenly fall to (7), returning and making a pinbar. Right now my reading is that there was a rejection at that level of resistance then I start to see a side market, with the background or "floor" support indicated in (7) and as resistance or "ceiling" the region indicated in (3) and (4).
Based on this interpretation, my focal points are 1 - EMA 20, 2 the background, to enter buying, and 3 the ceiling, to enter selling. In this situation, when I saw the ceiling I can stop in EMA 20 and probably will not have profit or it will be small, or the price will go down to the support, giving me a more profitable trade.
For this negotiation be a valid model, the EMA 20 must be situated between the two extremes of the trading range. It will be floating in the central region between these two limits, then the distance between these limits and EMA can not be too small. If the track is too narrow (less than 50 points), it is best to stay out of the market and operate other pair. You should wait until the prices come out of this range to re-operate the pair. Fortunately, there are dozens of other currency pairs to negotiate as we await a favorable situation in the pair under analysis.
When it happens crossing the MACD in (8) I buy at the breakout of signal candle (which is the previous candle) and place my stop loss below the signal candle. When the price reaches near the top and begins to retreat I leave the trade.
When prices come in (9) and reverse, this confirms the top of the trading channel. There is a candle that penetrates the resistance area and the next candle is its opposite, setting up a classic sign of reversal. I enter the next candle when it goes up a little bit and then starts to fall, coming below the opening price. There lay my entry with stop loss above the same candle entry. There crossing in SMAs and MACD. 3 candles by the price falls across the center of the channel, where is the EMA 20, without acknowledging it. When it comes in (10) the reverse prices, reaching out to touch the EMA 20 from the channel bottom. However, as there is no crossing of SMAs and MACD, I come not buying. Prices fall back to and several candles are playing in the support region, until one of them shows more strength, just as happens the intersection of SMA and MACD.
I go with a buy order in next candle, at the point where the top of the signal candle is exceeded (breakout). The stop is a little big, but as my target is the top of the channel, it is worth the risk.
The price reaches again the top of the channel (12), but this time he stopped to 'lean' on EMA 20. This may mean that the strength of the channel is already lower than the previous trade. However, as in (12) the price fell, the channel remains valid. Prices go up (13), beyond the limits of the channel, but this is a 'false breakout', then prices plummet again, penetrating again in the channel, which remains valid. Upon returning, the price drew a rejection bar above the region, which shows that from that point there is selling force.
In (14), the bar comes to rise, but quickly drops to its opening paragraph, enabling a sell. The stop loss is placed on top of the entry candle. There is also the intersection of SMA and MACD. Again the bottom of the channel is reached, with excellent profit.
Note that in (16) prices have not fallen as much, and the support is slightly higher than that of the point (10).
Now the London session has closed, but as there is the crossing of the MACD (17) and MAS, and reversal candle, I go shopping again, as prices fell as a little and went back to the entry point, allowing entry with stop loss placed below the entry candle. Prices will even EMA20 and stop. Already there is less volume and volatility, and some candles keeps the price in the center of the channel. Seeing that the trade would not evolve I get out of trade, ending the day.
Generally should not trade in the period between the final hours of the New York session (end of day) and the opening of Tokyo.
The next day, with the crossing of the MACD (19) and SMAS, prices rise to the top of the channel again (20), so when the Tokyo Stock Exchange opens and puts more money in the market.
6 are winning trades, no loser. 1420 points or 142 pips (5 digit broker). On average the profit was 3 times higher than the risk used (average size of stop loss). Results from a simulation, not real account.