Hello everyone,
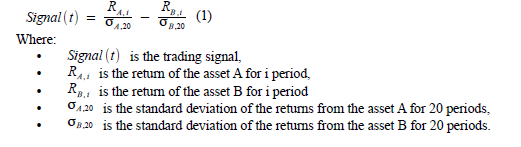
I am new here. Here is a simple pairs trading formula for calculating the spread between two assets
(equation 1).
So, I have backtested a simple pairs trading strategy on the german bond market, especially on the
pair Euro-bund/Bobl (Euro-bund = 10 year treasury note futures and Bobl = 5 year treasury note
futures for the german bonds). I don't test the correlation between the two assets, but in general it is
pretty high (over .90 or 90%).
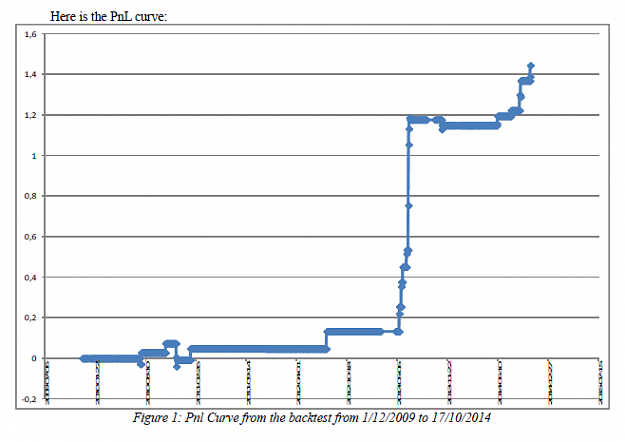
So, here is the backtest I have done on the past five years (1/12/2009 – 17/10/2014). In the datas
that I used, some gaps are there (no data between 28/2/2013 and 29/4/2013 excluded and between
30/8/2013 and 2/10/2013 excluded). The prices used are the close prise on the Euro-Bund and
BOBL futures (EUREX) from 1 december 2009 to 17 october 2014.
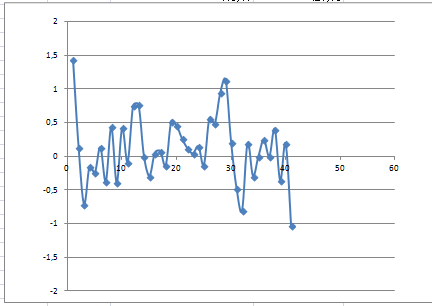
Here is the formula to measure the discrepancies between the two assets:
Here are the trading rules:
• No stoploss because we assume that the capital and the margin call are not a limit,
• A position is opend each time the threshold of 1 is crossed upward for +1 and downward for
-1, just one cross (for example is the signal passed from -0.9 to +1.1 a position is opened),
• The position(s) opened is closed once the mean (0) is crossed downward for a +1 cross and
upward for a -1 cross
• The parameters are i = 1, A is the Bobl futures and B is the Euro-Bund futures,
• The trading period is the beginning of the month from the futures contrat ending the same
month and the end is the last trading day of the month previous the futures contract ending
the month after (for example for the setpember 2014 Bobl futures, the trading period would
be the June 2nd 2014 to August 29 2014),
• In order to calculte the signal, 20 previous datas are taken from the same futures contrat of
the trading period.
It is possible to backtest more periods from the equation 1, but if I chose the return of 1 period and
the standard deviation from the last 20 periods the reason is 1 for the mispricing on a daily basis
and the 20 for a averaged volatility of the return on the last trading month numbered in days.
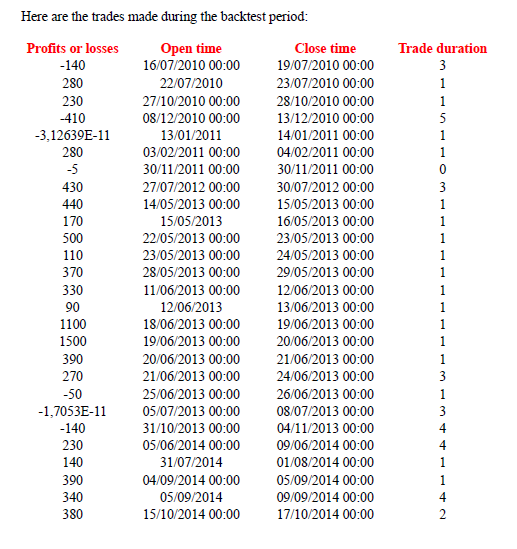
The results are as follows:
• Sharpe ratio = 0,25
• first drawdown from 29/11/10 to 30/7/12 about 10,6%
• second drawdown from 24/6/13 to 9/6/14 about 3,3%
• 27 trades in total
• Winning rate of 74,07%
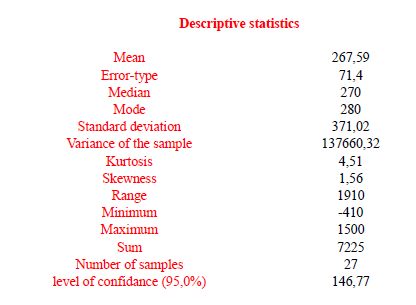
Here are the descriptive statistics:

Conclusion:
The results are very interesting and without parameters optimization because of the lack of datas (two
gaps) and the data-mining or data snooping bias (which means the overoptimization of the
parameters of the model based on transient noise in the historical data).
The histogram of profits and losses shows a positive skewness, so this pairs trading strategy seems
profitable. Bootstrapping method or Monte Carlo simulations could confirm that, but with only 27
occurencies in a sample is borderline. Besides, the two gaps in the data put the trading results at
stake, because big losses could happen.
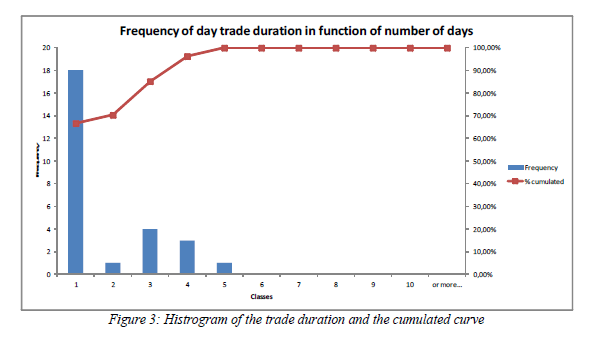
More than 66% of the trades are closed after 1 day duration or 2 consecutive trading days. The
winning rate is 74,07% and the losses are largely overwhelmed by profits. This short time exposure
on the german bond futures market is interesting because it is possible to add some identical pairs
trading strategies on the same futures account. In doing so, the profits could be larger and the losses
as well.
I am new here. Here is a simple pairs trading formula for calculating the spread between two assets
(equation 1).
So, I have backtested a simple pairs trading strategy on the german bond market, especially on the
pair Euro-bund/Bobl (Euro-bund = 10 year treasury note futures and Bobl = 5 year treasury note
futures for the german bonds). I don't test the correlation between the two assets, but in general it is
pretty high (over .90 or 90%).
So, here is the backtest I have done on the past five years (1/12/2009 – 17/10/2014). In the datas
that I used, some gaps are there (no data between 28/2/2013 and 29/4/2013 excluded and between
30/8/2013 and 2/10/2013 excluded). The prices used are the close prise on the Euro-Bund and
BOBL futures (EUREX) from 1 december 2009 to 17 october 2014.
Here is the formula to measure the discrepancies between the two assets:
Attached Image
Here are the trading rules:
• No stoploss because we assume that the capital and the margin call are not a limit,
• A position is opend each time the threshold of 1 is crossed upward for +1 and downward for
-1, just one cross (for example is the signal passed from -0.9 to +1.1 a position is opened),
• The position(s) opened is closed once the mean (0) is crossed downward for a +1 cross and
upward for a -1 cross
• The parameters are i = 1, A is the Bobl futures and B is the Euro-Bund futures,
• The trading period is the beginning of the month from the futures contrat ending the same
month and the end is the last trading day of the month previous the futures contract ending
the month after (for example for the setpember 2014 Bobl futures, the trading period would
be the June 2nd 2014 to August 29 2014),
• In order to calculte the signal, 20 previous datas are taken from the same futures contrat of
the trading period.
It is possible to backtest more periods from the equation 1, but if I chose the return of 1 period and
the standard deviation from the last 20 periods the reason is 1 for the mispricing on a daily basis
and the 20 for a averaged volatility of the return on the last trading month numbered in days.
The results are as follows:
• Sharpe ratio = 0,25
• first drawdown from 29/11/10 to 30/7/12 about 10,6%
• second drawdown from 24/6/13 to 9/6/14 about 3,3%
• 27 trades in total
• Winning rate of 74,07%
Here are the descriptive statistics:
Attached Image
Attached Image (click to enlarge)
Attached Image
Attached Image
Attached Image
Conclusion:
The results are very interesting and without parameters optimization because of the lack of datas (two
gaps) and the data-mining or data snooping bias (which means the overoptimization of the
parameters of the model based on transient noise in the historical data).
The histogram of profits and losses shows a positive skewness, so this pairs trading strategy seems
profitable. Bootstrapping method or Monte Carlo simulations could confirm that, but with only 27
occurencies in a sample is borderline. Besides, the two gaps in the data put the trading results at
stake, because big losses could happen.
More than 66% of the trades are closed after 1 day duration or 2 consecutive trading days. The
winning rate is 74,07% and the losses are largely overwhelmed by profits. This short time exposure
on the german bond futures market is interesting because it is possible to add some identical pairs
trading strategies on the same futures account. In doing so, the profits could be larger and the losses
as well.
Attached File(s)