Attached Image (click to enlarge)
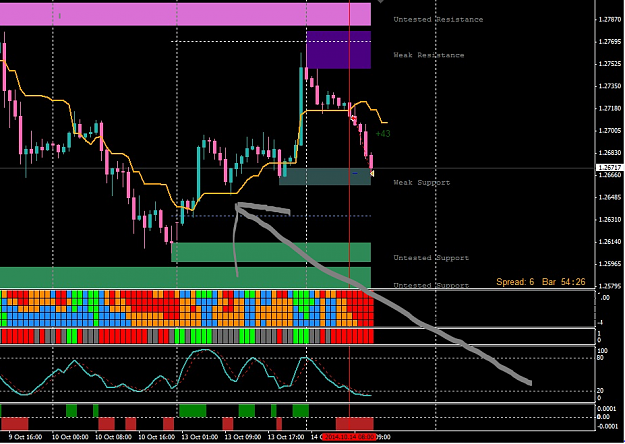
how does this make it koppel87 for 126.50 is also weak support for on 2014.10.13 and price is here right now
Or it is not make it to end of wick only the color bar for this because it doesn't count wicks for support lines?