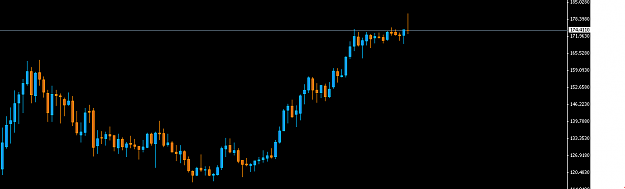
175 was hit! woo!
so, I like to check out crazy non-standard time frames.
I trade price action off S/R, so shifting time frames and the start of bar times helps me see price action in ways I wouldn't have otherwise.
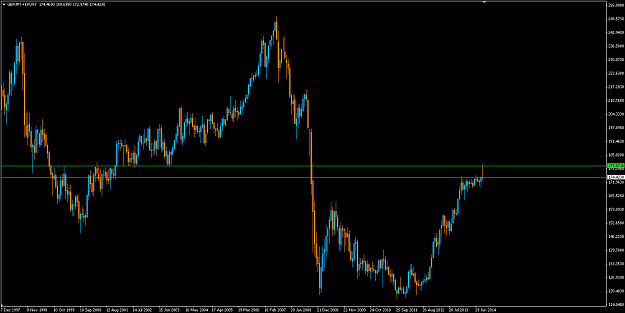
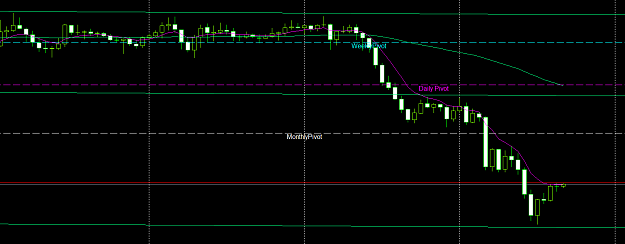
Take this screen cap, for instance. It's a three-week-bar chart of GBP/JPY.
We've been in a nice uptrend for a while now, but it has sorta tapered off at the top this past year.
Now there's an adequately sized bearish pin bar shaping up. The bar closes at the end of this week.
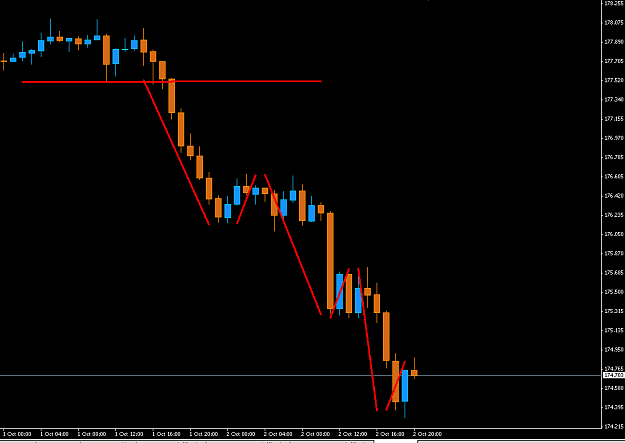
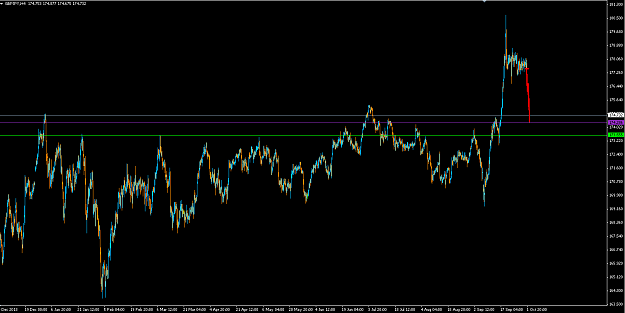
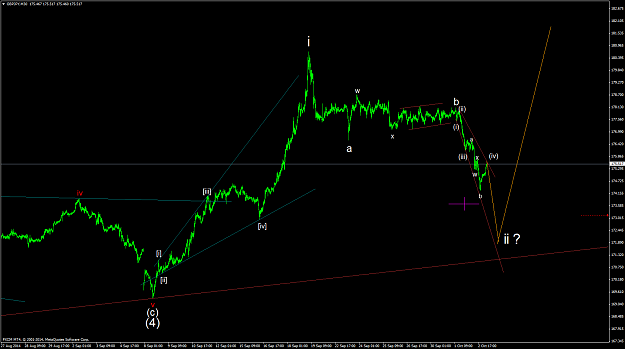
This is coming off a significant bearish reversal on lower time frames, as we've all seen (and hopefully not lost too much money on).
At any rate, I usually lurk and keep all this to myself. I'm pretty bad about actually participating in forum conversations. Just food for thought. I hope it makes sense to somebody somewhere.
so, I like to check out crazy non-standard time frames.
I trade price action off S/R, so shifting time frames and the start of bar times helps me see price action in ways I wouldn't have otherwise.
Take this screen cap, for instance. It's a three-week-bar chart of GBP/JPY.
We've been in a nice uptrend for a while now, but it has sorta tapered off at the top this past year.
Now there's an adequately sized bearish pin bar shaping up. The bar closes at the end of this week.
This is coming off a significant bearish reversal on lower time frames, as we've all seen (and hopefully not lost too much money on).
At any rate, I usually lurk and keep all this to myself. I'm pretty bad about actually participating in forum conversations. Just food for thought. I hope it makes sense to somebody somewhere.
Attached Image (click to enlarge)