![]() ► Financial Markets Observatory Lab. ◀
► Financial Markets Observatory Lab. ◀![]()
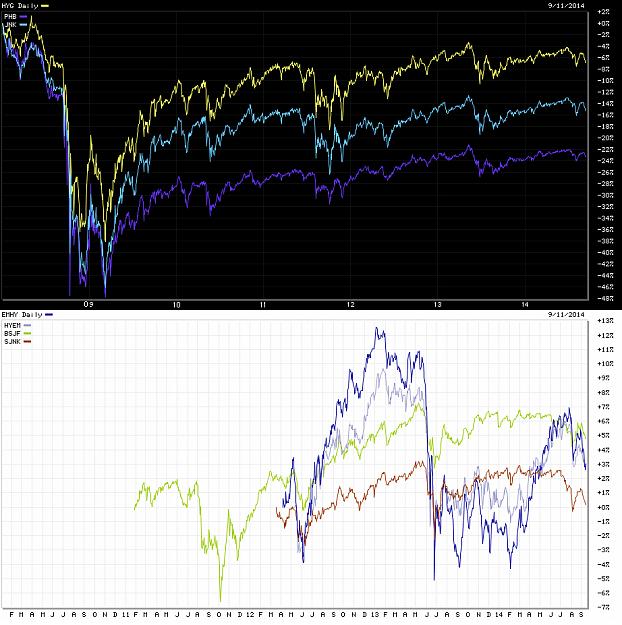
Some notes/charts about the Option-Adjusted Spread curves of BoA & Merrill Lynch for US Corporate Bond.
Aim of the post.
☒ In this post there are some data about the Option-Adjusted Spread (1), (2), (3), curves of BoA & Merrill Lynch for US Corporates.
These curves are financial stress indicators of comporate bonds, about contrarian to main trend of underlyings and with an interesting anticipatory behaviour.
In this post there are two OAS-indicators:
-) the average OAS of the corporate bond segments AAA, BBB, CCC;
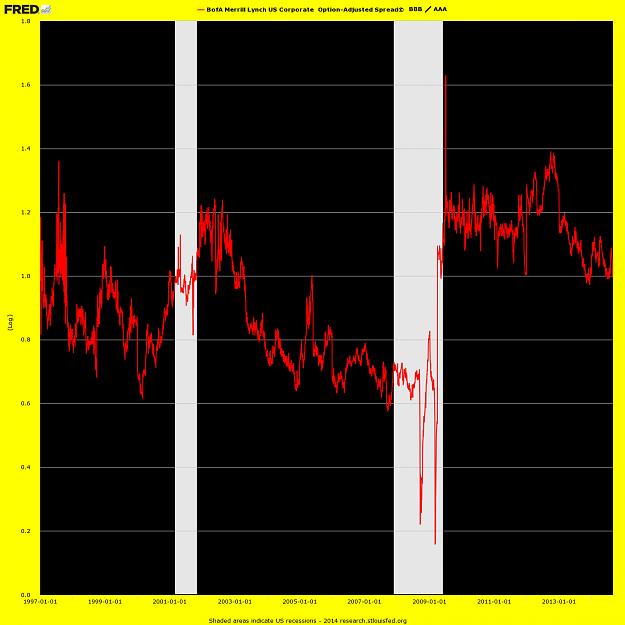
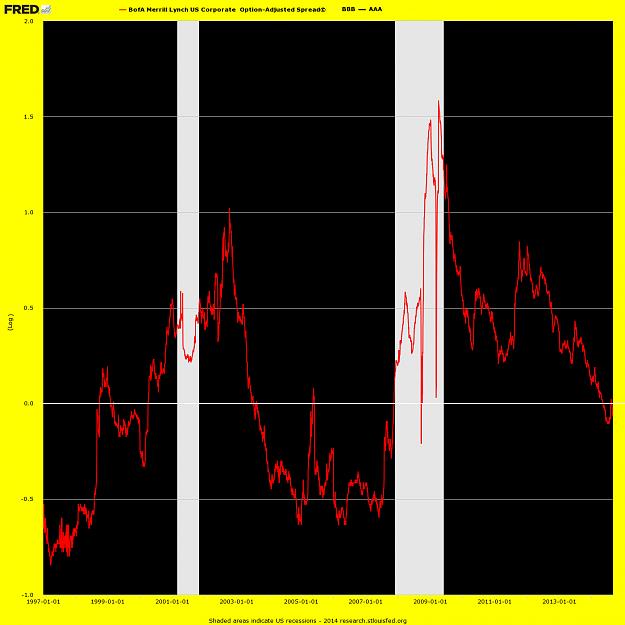
-) the ratio between BBB vs. AAA segments.
Average OAS and BBB/AAA ratio are in logarithmic scale only on 'y' prices (semi-log. charts), with napier base (base = e).
Previous posts.
❖ June.2012 -- 2011.
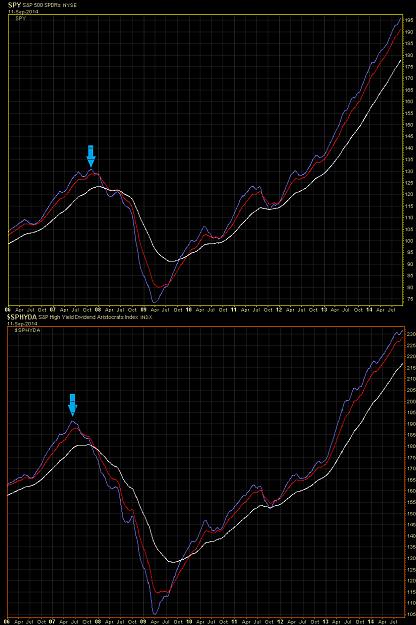
General stocks-benchmarks usefull for this post.
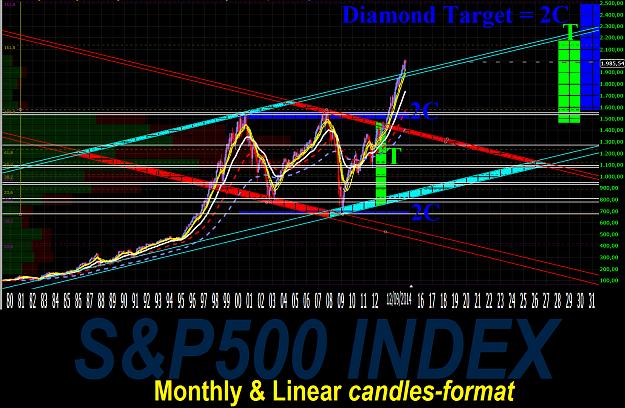
► global U.S. stocks-benchmarks (charts & notes: EUSA; ITOT; IWB; IWV; IYY; THRK);
► global World stocks-benchmarks (charts & notes: ACWI; DGT; IOO; NYSE W.L.I.; ONEF; VT).
Main graphical elements.
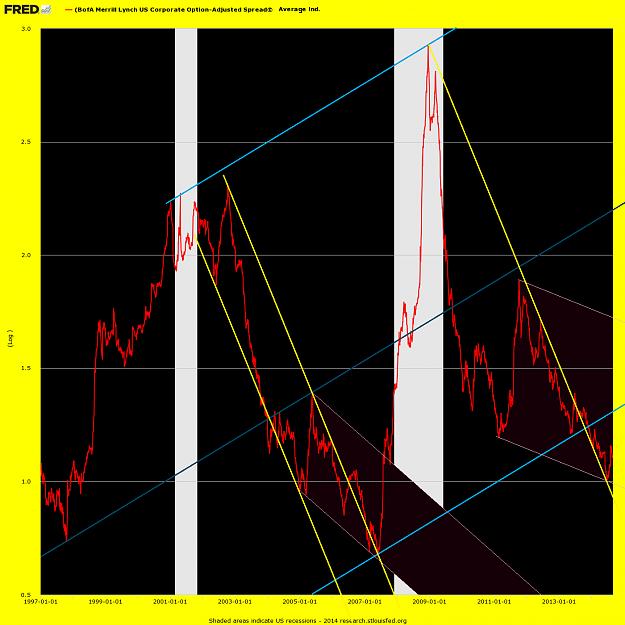
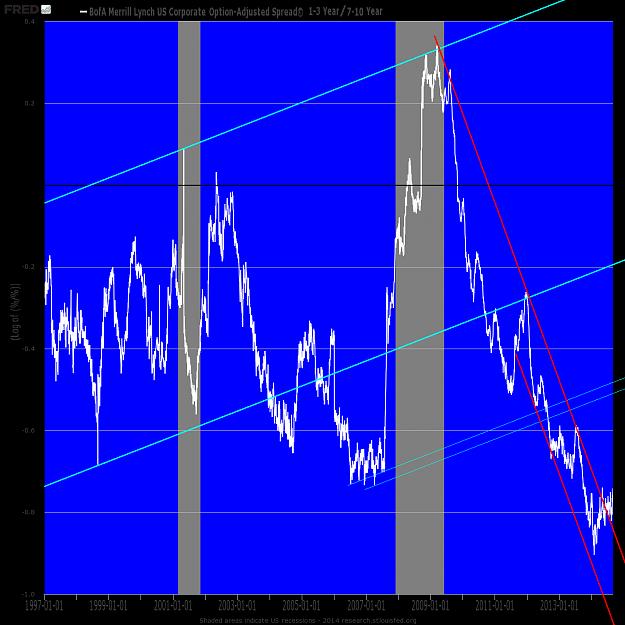
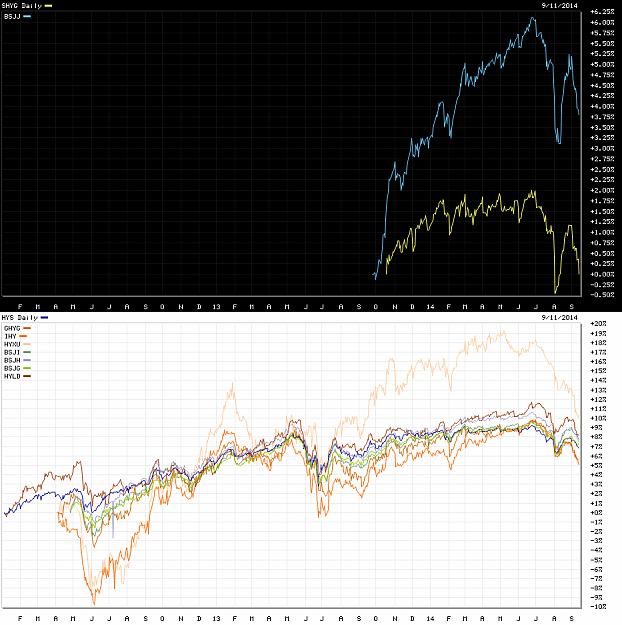
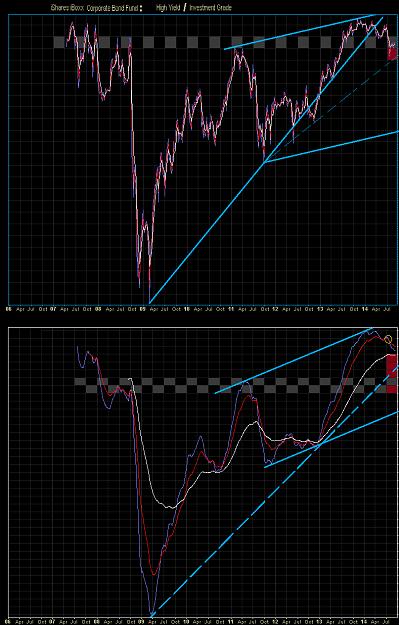
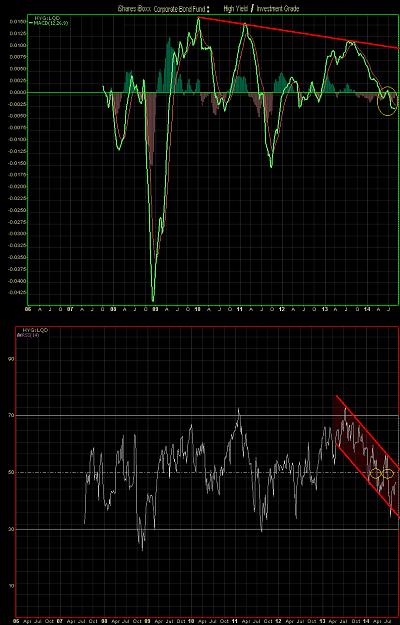
The average OAS shows a double Sell ʕ•ᴥ•ʔ Off from the top of chart in 2008/2009 (see blue trend-lines).
After this double event, the level of curve exhibits very low values of financial stress.
In the III quarter of 2014 there is a little loss of momentum, with a small divergence vs. underlyings.
Current values of OAS average are again well above the previous lows of 2007 !!!
The global structure of this indicator is stress-less.
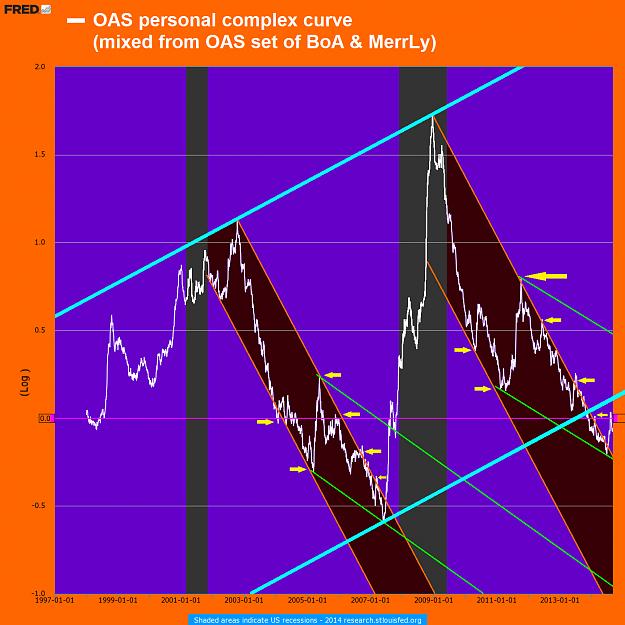
The BBB/AAA OAS shows current levels stress-less, but well above the previous lows of 2007 (except two long deeps of ratio-format).
References.
(1.)-http://en.wikipedia.org/wiki/Option-adjusted_spread
(2.)-http://www.investopedia.com/terms/o/optionadjustedspread.asp
(3.)-http://www.riskglossary.com/link/option_adjusted_spread.htm
Chart sources.
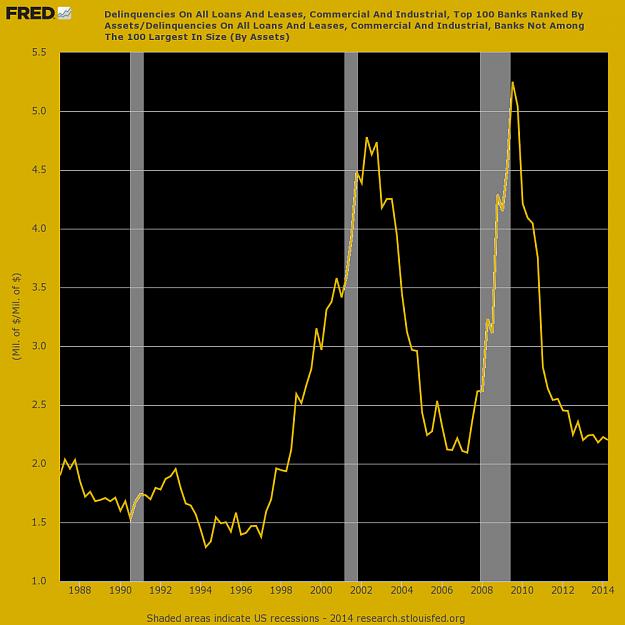
❖ St.LouisFED.
Sorry for my bad English. I hope that this post is at least minimally useful (Contact ����).
Tuned on main trend, but follows short-medium term signs from underlying prices, for a correct & real-time set-up.
It is very important do not anticipate the main trend of the underlying financial instruments.
☻/♪ ❖ EARTH.pk, Alert 2.O !!! ❖
/▌
/|
I.M.O. by Sa!Vi ►►♥
#KèSaddhaPhàPéKampà: #BundaBunda €MP¥R€ ❣!!!❣
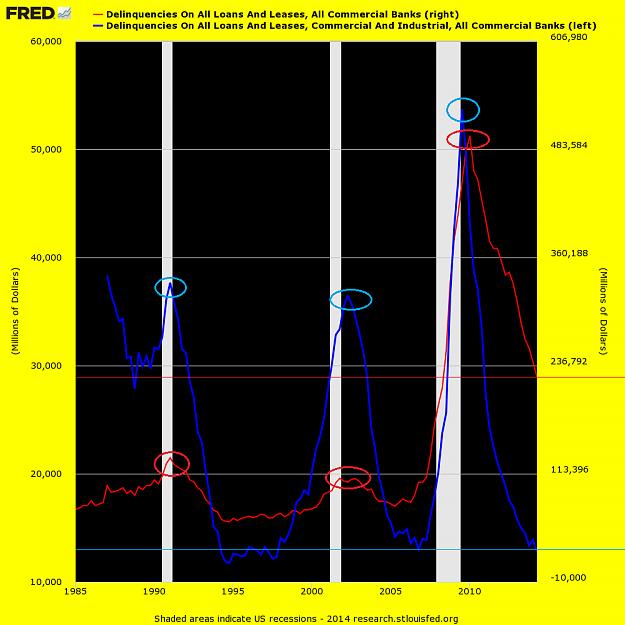
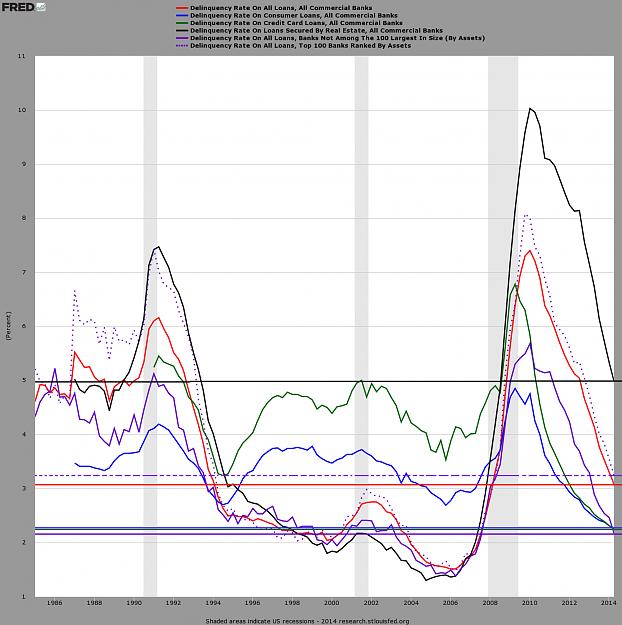
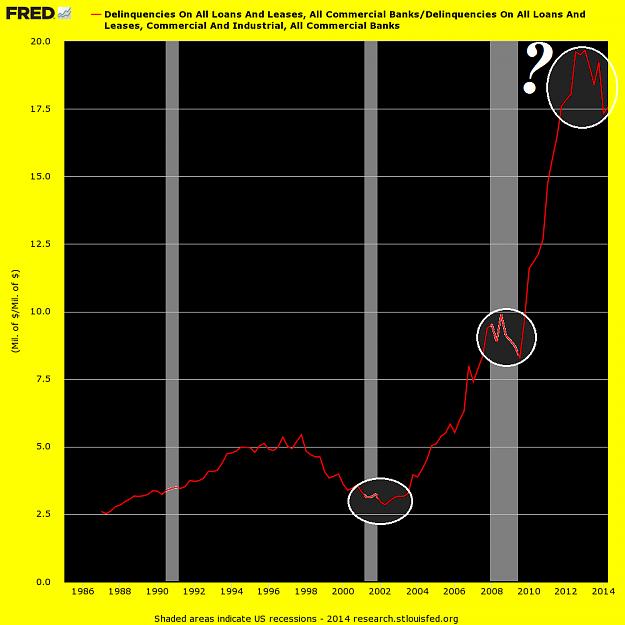
Historical Curve Components
http://research.stlouisfed.org/fred2...raph.png?g=IUp
http://research.stlouisfed.org/fred2...raph.png?g=IUs
http://research.stlouisfed.org/fred2...raph.png?g=IUt
Attached Image(s) (click to enlarge)