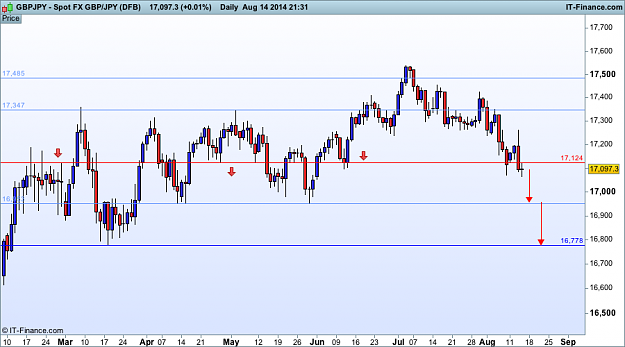
Disliked{quote} @pipster1: I guess if you have the time and we all wait patiently and two weeks pass we can have this same discussion again. I only hope you don't forget to bring it up when the market is going where it wants to go then. Lets See What Happens Please remember, I am just publicly sharing my trading plan. It hurts no one to do so. Will you please cross your fingers for meDown to the DEMAND ZONE we go
Ignored
We trade different time frames so by August 27th, I will have had multiple trades both long and short so the point is irrelevant. I understand that many people on this blog trade longer term and add multiple positions at key levels even if the trade is in the red. I was only questioning the timing and level of your posted entry. My question: even as a longer term trader, wouldn't it be prudent to wait to go counter trend once there is solid evidence that the move is reversing?
I see many FF traders using fibo levels, psychological levels, and pivots, along with supt/res areas to jump into trades. To me these provide flimsy evidence if you are going against PA with a strong trend. The traders who are continually counter trend are the ones have a real challenge sustaining profitability. Not to say I don't take CT trades, I took 3 today, but I stay 1-1 when CT and have a quick lock profit level.
It seems you have quite a following here and people respect your opinion. I was serious when I asked what you use as a trade trigger, or factors you consider when entering a trade. Below is my progression I use before most entries. Feel free to offer any ideas that may improve things. I use median renko charts for my entry and midrange charts and generally only trade EU & GU.
This is the general progression I consider before initiating a position.
1) Is red news pending on your pair? If so consider waiting.
2) Consider the Daily Chart
a. Support/Resistance
b. Waves of Movement
c. Trend Lines
d. Indecision Candles
e. Major Psychological Levels
3) Consider the M8 Chart (H1 to H6 time frame)
a. Support/Resistance
b. Waves of Movement
c. Trend Lines
4) Will your trade be with the trend or counter trend? Breakout or swing? Adjust TP accordingly (1-1 RR on CT)
5) On the M3 Chart (M5 to M30 time frame) is there a valid entry pattern in a solid area of M8 support and resistance? Head and shoulders, double top, pulse pattern, triangle breakout etc...
6) Does the risk reward ratio make sense?
7) How are parallel pairs behaving? For instance, if the GU and EU trading in opposite directions, this may signal a risky market and warrant a non-trade.
8) Time consideration. Do you want to hold the trade overnight? Is the market entering a time of low volume? For example: after US market close. If so, it may be prudent to stay out of the market.
9) Map your trade using pending order, xbuy/sell, SL, & TP lines. Once things are set….turn off your screen. Set it and forget it until an alert appears on your phone, then adjust accordingly.
10) If in doubt…STAY OUT!
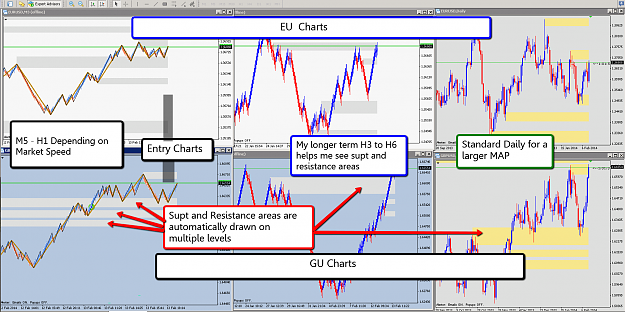
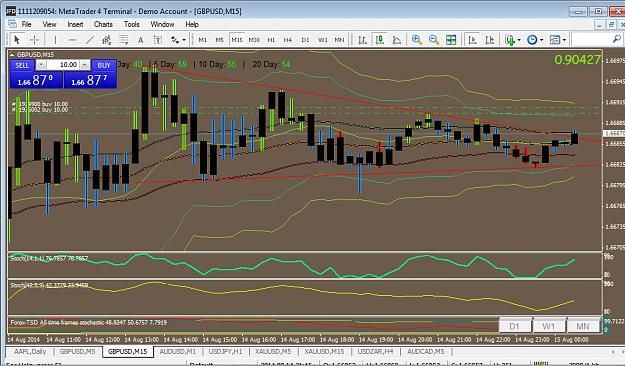
So basically I consider PA on 2 higher time frame charts, then look for a solid entry pattern in a good area on my lower time frame median renko entry chart (M5 to M30)
The image is what my trading screen looks like. Been trading for 5 years (last 2 profitable)
Thanks for responding and helping others on this thread.
Attached Image (click to enlarge)