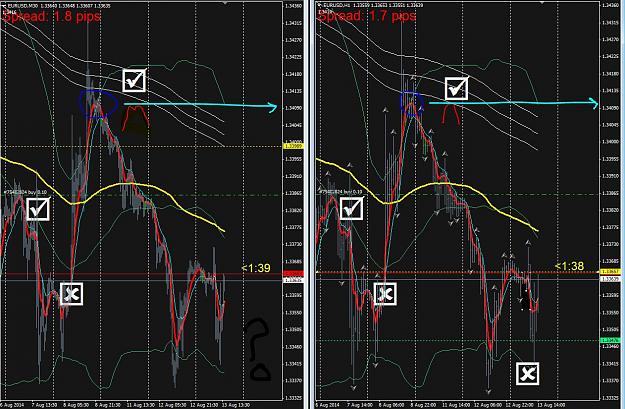
Disliked{quote} Hi. that picture is made up uf 1hr and 30min charts. Both look very similar. Buy there is a dis-similarity. One the 1hr chart there are 4 white symbols. but on the 30min, there are only three. So, the market has to move in a way to create 4 on the 30min(so that both chart are in sync again). The only way that can happen is for price to go UP!!!!Ignored
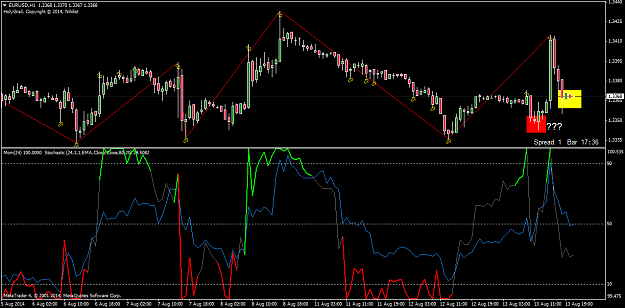
What I'm seeing is that there is a "double hump" on the 30M which doesn't appear on the 1H. The price this occurred at was roughly 3409.
In terms of Fundamentals that I know of, there was chatter of fund managers etc wanting a decent place for shorts. I had thought that 3424 would have been sufficient, but since there were other news items that occurred over the last 3 trading days, the 3409 may have provided an opportunity for a sell. This took place which brought price down, but then shot back up to close that arbitrage.
Attached Image (click to enlarge)
A pip is only worth it if you know how much you risked to earn it