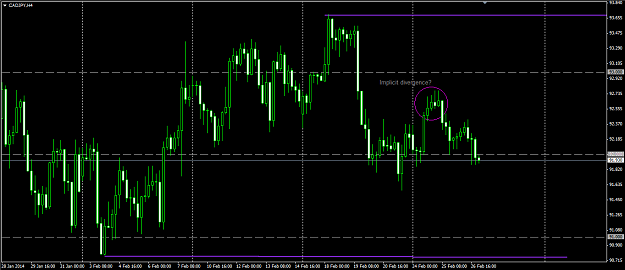
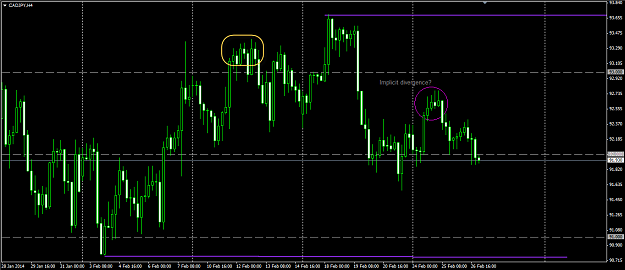
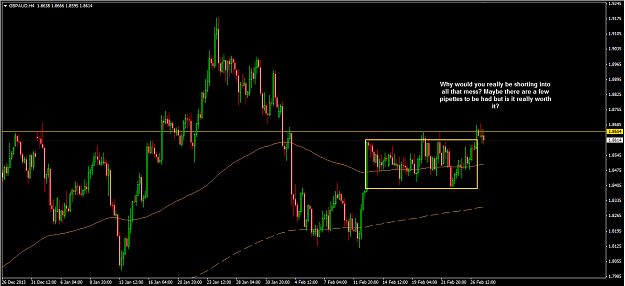
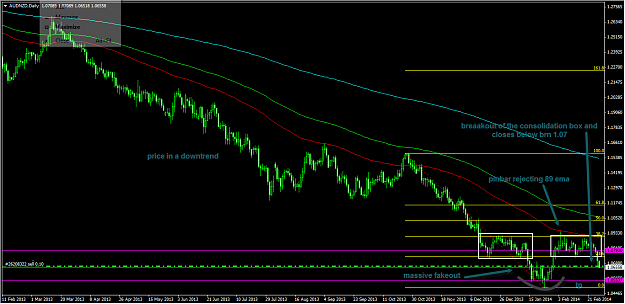
Disliked{quote} You made me think of making up an "order flow" story. I do not consider myself to be an expert, but I will try anyway. Suppose in the gold rectangle area traders are waiting to go short on a retrace alongside allready traders being short. They got "captured" by the sudden strong bullish move. A pullback starts (see blue rectangle). Not as strong and fast as the bull move but decent enough I think to make a lot of traders think the downmove resumes which make the early bulls close their positions. The trapped bears are hoping they can get...Ignored
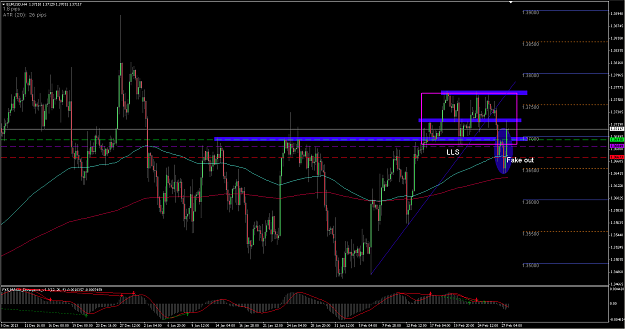
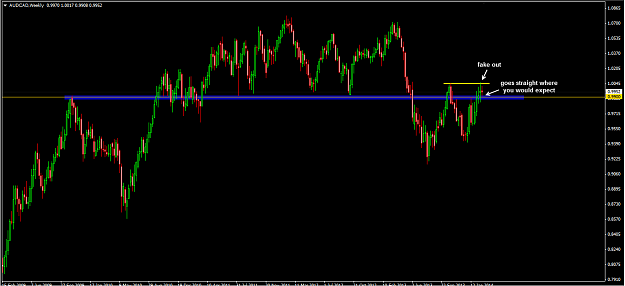
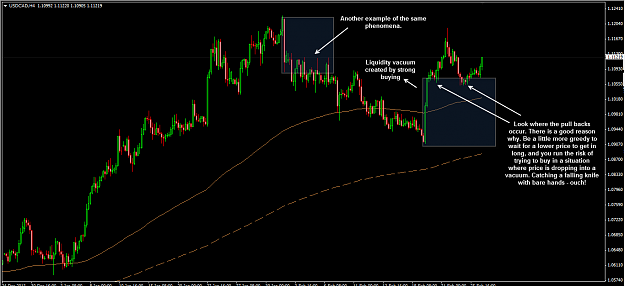
Think of your large strong bullish / bearish bars as representing a period of "vacuum". Most trading will occur in the times that price is sideways, i.e consolidating. Large sudden moves, represent thin volumes where price is spiking to find the next point of equilibrium where the traders can interact. When printed on the chart they will leave their impact, meaning that when price pulls back to these, the participants are very aware of how that could prove to be an area of "least resistance" and if price ends up pushing into the vacuum it will likely just fall through.
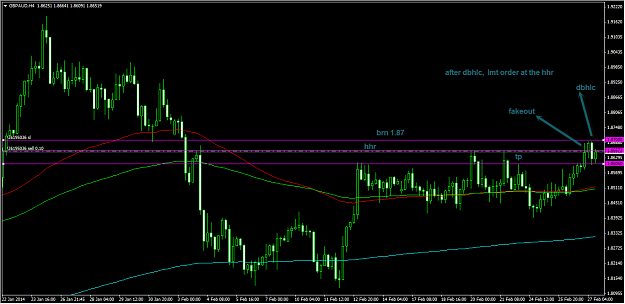
So if any buyers were serious about buying USD/CAD on a pull back the best price they could get, without attracting danger, was just above the high range bar.
This also explains why most of the popular demand and supply zones tend to get drawn right off the edge of these large range bars.
This can be advanced stuff for most, and I totally understand that. Do ask if anything is unclear.
g.
Attached Image (click to enlarge)
I believe . . .