Disliked{quote} Hi Iqyu5an, Nice simple chart. Can you explain why you draw your fib so, I mean how you selected this hi/lo. Also, your sell order is clicked already or it is pending order? If it is clicked already then looks like you took break-out trade?Ignored
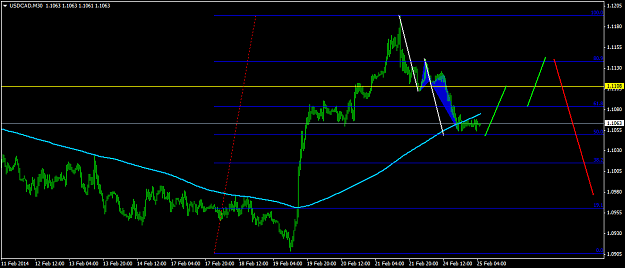
a) i check ichimoku to identify possible buy or sell
b) draw fib from 1.09xx to 1.12xx
c) focus on 11.9 or 80.9
d) watch carefully PA around my area of interest ( especially false break candle on any time frame ) and ....push the button
e) set the target by moving fib to closest Hi Low swing ( as seen on chart )
not euphoria follower