Hi, whey you choose a combo to trade, e.g. weekly/H4, do you also draw all the levels on monthly and daily?
Ignored
Alfonso has suggested, when learning the method, to really focus on just the two timeframes of the combo (W/H4, M/D, D/H1). However, he also makes it clear that it's a very good idea (really it's necessary) to be aware of the highest timeframe levels no matter what combo you trade. This isn't a contradiction, it's simply a matter of keeping things as simple as possible while learning. What I'm doing is focusing on my combo TF's, but at least once in a while taking a peak at where the fresh levels of Weekly and Monthly levels are so I'm not taking trades directly in front of HTF levels.
{quote} Alfonso has suggested, when learning the method, to really focus on just the two timeframes of the combo (W/H4, M/D, D/H1). However, he also makes it clear that it's a very good idea (really it's necessary) to be aware of the highest timeframe levels no matter what combo you trade. This isn't a contradiction, it's simply a matter of keeping things as simple as possible while learning. What I'm doing is focusing on my combo TF's, but at least once in a while taking a peak at where the fresh levels of Weekly and Monthly levels are so I'm not...
Ignored
Yes basically sounds right what you are saying, but in practice sucks!
If it works for you great, continue that. When I got (or am getting) into the TF trap, I got lost. Make sure you do not end up staring on M1 charts, unless you have the combo selected accordingly for an appropriate HTF on M15-M30 TF!
It was just a suggestion, made based on my mistakes.
One other suggestion, run the MTF testing and check out what it means when you are in a supply/demand zone of multiple TFs...
There it comes handy really to know where you are, other than that I do not know (yet) advantage of any other TF, just confusion as a disadvantage.
...well if your Supply/demand zone is wide on your entry time frame it might be worthwhile to drill down one TF lower, as it is pointed out in Alfonso's webinars...but really that's it.
{quote} Hi Coolmoss! The CP was not validaded because it didn't remove those highs. Removing the highs is not necessary if there is ENOUGH room to next higher timeframe supply. But where price was, it didn't remove those highs on the left, which I believe was D1 supply. You don't want to buy against a non-broken HTF supply like the D1 supply or higher. IF price would have been far away from those highs, then you wouldn't need to remove it, but it was right there and it couldn't trade above it or close above it, so the CP pattern of demand would...
Ignored
Thank you! Yep, makes sense. It seems to me a reasonable approach to start real trading (when the time comes) is to simply not consider any trade that doesn't meet the strictest possible rules (eg. require opposing level absorbed, higher high created, HTF supply far away, etc etc). Obviously, this will cause very few trades to be taken, but it's a safe way to start. And this will truly test ones patience, which I think is a good thing.
{quote} Hi Coolmoss, I'm not sure, but I think your daily trendline is too strict, because it was drawn through CP patterns and not through obvious valleys. As I see the trendline was not broken on D1 if it is drawn trough valleys. The trend is up on Mn as the last SZ was broken. The downtrend is nice on H1 and as I see your plan is working, but you have to be carefully, because of higher TF-s trend.
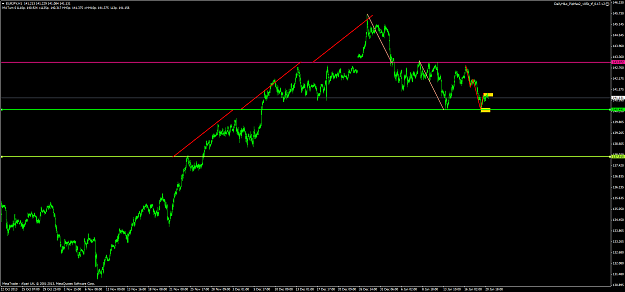
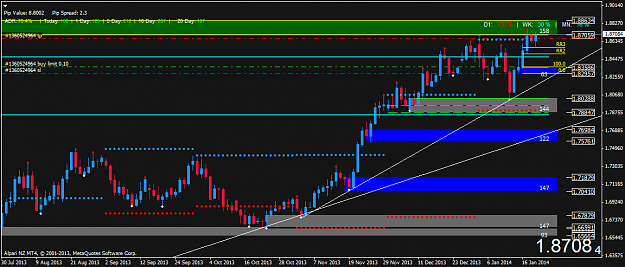
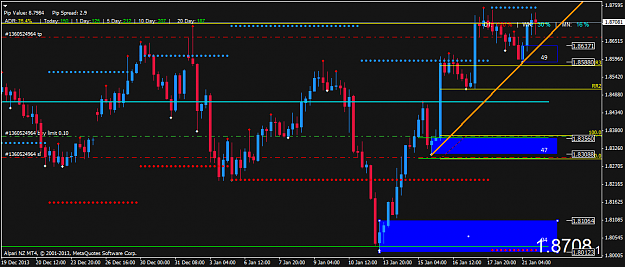
Here is a trade I'm proposing in the EURJPY using the Daily/1Hr combo. The reasons for the trade are as follows: a) lots of room to fall on the Weekly and not close to any demand on the Monthly b) Daily is in downtrend as defined by break of TL, previous demand being absorbed (orange rectangles in chart) and new supply levels being respected c) Daily supply is in control d) Daily HTF/curve demand level is far below e) H1 trend is down, TL being respected and price bouncing off D1 supply f) H1 level has good departure, little time at level, good...
Ignored
Hi, did you go long or short?
What is your conclusion after the fact, or at least having more data?
I know it is not part of present theory, but do not neglect either the equal moves (also after the fact, so it is easy preaching I guess , still pls consider )...
{quote} There is no secret material I didn't invent anything, I just created videos to show how I personally draw SD levels. There are several ways, taking the wicks, only the bodies of the basing candles. If you want my webinars you will see how I do it. I learnt it from free videos and information available out there on the internet on that matter, most are free videos by Sam Seiden webinars. Then I added certain nuances with trendlines, and rules on basing candles, that's all. Nothing is secret, it's out there if you, and can be easily tested...
Ignored
Hey Alfonso, sorry if you misunderstood! Yes I see no secret in anything you say or show! And tnx for all these!
I referred to the video once I have seen, and not available (removed)...as a "secret" . I just wanted to find the treasure in the hidden drawers, it is clear to me that in any webinar of yours I can still see and learn how to draw!
Tnx
{quote} Hi, did you go long or short? What is your conclusion after the fact, or at least having more data? I know it is not part of present theory, but do not neglect either the equal moves (also after the fact, so it is easy preaching I guess , still pls consider )... {image}
Ignored
Sorry for not being more clear on proposed trade: at the time of the post I was looking to go short if price rallied up into the level shown on the H1 chart. As it turned out, price did decline nicely before any movement toward my supply level, which I think suggests the idea to short was at least okay. Another poster pointed out the HTF's were not aligned with the trade, but I considered the trade as viable because price was not immediately in front of a HTF level and (at least) on the Weekly there are no demand levels anywhere close to current price, so potential for big move down.
{quote} Alfonso has suggested, when learning the method, to really focus on just the two timeframes of the combo (W/H4, M/D, D/H1). However, he also makes it clear that it's a very good idea (really it's necessary) to be aware of the highest timeframe levels no matter what combo you trade. This isn't a contradiction, it's simply a matter of keeping things as simple as possible while learning. What I'm doing is focusing on my combo TF's, but at least once in a while taking a peak at where the fresh levels of Weekly and Monthly levels are so I'm not...
Ignored
Yep, exactly. It's like driving on a highway. You know you are on the right lane, there are no new entries to the high way on the right side where you are driving. You are driving safely with your favourite music, nobody is going to bother you. You don't need to look at the left lane in case there is a car trying to overcome you. Why should you?
But... what if you wanted to overcome the car in front of you? Would you look left through the mirror to see if there are any cars on the left lane before you decide to turn the wheel left? Wouldn't you? Wouldn't it be safer? Your life is in danger if you don't do that. SAME on trading. When you want to take a trade, MAKE SURE you are not going against the higher timeframes when you take it, PEEK! Your life is not in danger, but your money is
Alfonso
Set and Forget supply and demand trading community
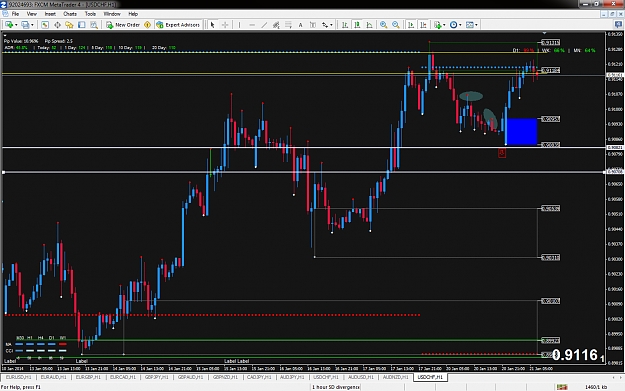
Yesterday( 20 Jan 2013) around 21h00 UTC, I had my USDCHF, 1 hour( attached). Please note that demand zone ( range: 090957-0.90835) was not drawn at that time. I thought that price was going to go through( short) demand zone drawn ( lavender colour): 090821-090708( with a speed bump) as price has been making lower highers ( circled) and I was higher on the daily curve( above 90%), although weekly and monthly curves favoured a buy.
Can u explain why did the price ended uo going up instead of short? Was my analysis correct?
Hello everyone I hope Alfonso or someone here can help me. Yesterday( 20 Jan 2013) around 21h00 UTC, I had my USDCHF, 1 hour( attached). Please note that demand zone ( range: 090957-0.90835) was not drawn at that time. I thought that price was going to go through( short) demand zone drawn ( lavender colour): 090821-090708( with a speed bump) as price has been making lower highers ( circled) and I was higher on the daily curve( above 90%), although weekly and monthly curves favoured a buy. Can u explain why did the price ended uo going up instead...
Ignored
Hi there,
I can't explain why price did something different yo what you expected Nobody can The markets do whatever they have to do, you just have to have rules that will allow you to take a trade or not.
As far as the short is concerned, remember the USD Index is rallying higher, the euro is dropping and price is at a D1 supply on USDCHF. You need confirmation to short the USDCHF or wait for the D1 supply to be removed before you can buy.
Alfonso
Set and Forget supply and demand trading community
I have found a suitable trade opportunity. It is on GBPAUD Mn/D1 combo. The price is far away but if it will return than we can buy. Please check the case and do commnents.
The Mn SZ was broken at 1.8476 and the next SZ is far away. So the trend is up.
Attached Image (click to enlarge)
There is a valid (upward) trendline on the D1 chart and a CP pattern which is a DZ (at 1.8359). The price can return to this level without breaking the trendline. The RR is 3.
Attached Image (click to enlarge)
If now the price breaks the D1 SZ than there will be another trade opportunity on W1 H4 combo. The trend is up on W1 and after breaking D1 SZ (distal line at 1.88634) there will be a valid upward trendline on H4 (orange). After the D1 SZ break will be valid the DZ on H4 (blue box at 1.8637).
I give up, I've been backesting supply and demand for 15 days, and I can't make profits, at least it was on Forex Tester 2, so nothing lost, except my time..
I give up, I've been backesting supply and demand for 15 days, and I can't make profits, at least it was on Forex Tester 2, so nothing lost, except my time.. Hope you do better.
Ignored
It takes more than 15 days to know if something works. Can you learn to speak English in 15 days? You can't. You also need to follow the rules, but if you don't work hard for quite a long time you will not know if you are doing things correctly or not. It's a difficult thing, not easy. How do you know u are doing things correcly? I've not seen any of your charts. You might be making mistakes in your decisions, but you can't know. But definitely 15 days is nothing. If I had spent only 15 days backtesting I would be here really, I would have given up.
Wish you the best with any other strategy that you try!
Alfonso
Set and Forget supply and demand trading community
I give up, I've been backesting supply and demand for 15 days, and I can't make profits, at least it was on Forex Tester 2, so nothing lost, except my time.. Hope you do better.
|
Joined Aug 2011
|
Status: Trying to improve
|73 Posts
Hi Alfonso ! Thanks for a nice and informative thread. I have one question about supply and demand indicator. Sometimes when i see a rectangle drawn by an indicator and price came to touch it but not brake, the rectangle deletes itself. Is it a bug or there is some kind of formula when the rectangle deletes even the level is not broken.
Hi Alfonso ! Thanks for a nice and informative thread. I have one question about supply and demand indicator. Sometimes when i see a rectangle drawn by an indicator and price came to touch it but not brake, the rectangle deletes itself. Is it a bug or there is some kind of formula when the rectangle deletes even the level is not broken.
Ignored
Hi there!
That's something the automatic SD indicator does itself, it repaints sometimes when the level is not yet well formed. I'm not using the automatic SD indicator so I don't have those problems. It happens sometimes only, the exact formula is complex, based on zigzag, and zigzag repaints.
Alfonso
Set and Forget supply and demand trading community
|
Joined Aug 2011
|
Status: Trying to improve
|73 Posts
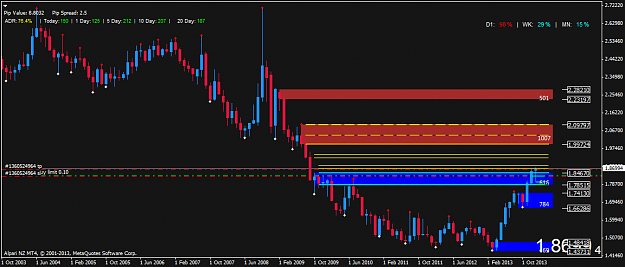
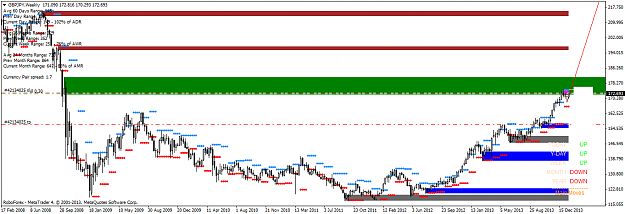
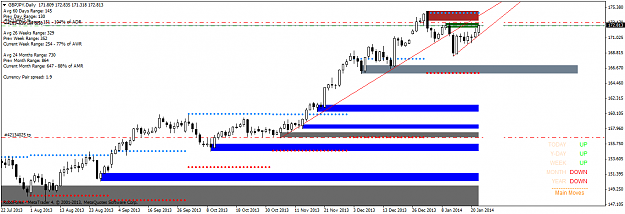
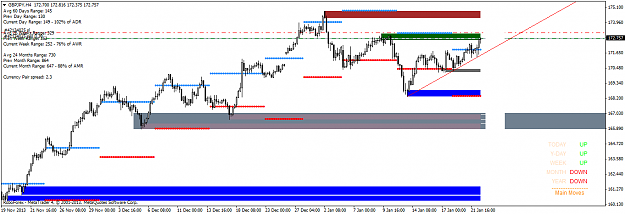
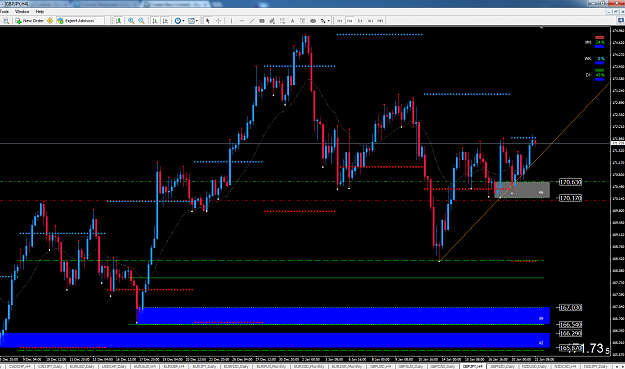
Thanks for an answer. Besides what are your thoughts about GbpJpy current situation? In my opinion we have a CP pattern on a weekly TF, also high in the curve on daily and we have fresh and original h4 supply. Moreover we have one broken trendline to the downside. And one thing which i dont like, there is also one new trendline to the upside.
Thanks for an answer. Besides what are your thoughts about GbpJpy current situation? In my opinion we have a CP pattern on a weekly TF, also high in the curve on daily and we have fresh and original h4 supply. Moreover we have one broken trendline to the downside. And one thing which i dont like, there is also one new trendline to the upside. {image} {image} {image}
Ignored
Well, High timeframes are up on GBPJPY so I am not going to go counter trend in a small H4 supply zone with that look. In fact I am long on GBPJY, my trade is more than 200 pips right now. Brand new H4 direction with new H4 TL, the HTF are with me, so long is the only thing I want to do on GBPJPY and Yen cross pairs.
My D1 demand entry was missed by a few pips, it's a pity, but then a new H4 ascending TL is formed, it's time to go long again. Also the H4 descending TL had been solidly broken. What caused that break? The H4 demand I took. That H4 CP supply was attacked 3 times, the last 2 times price went higher. Lots of confluences of supply and demand.
Alfonso
Attached Image (click to enlarge)
Set and Forget supply and demand trading community
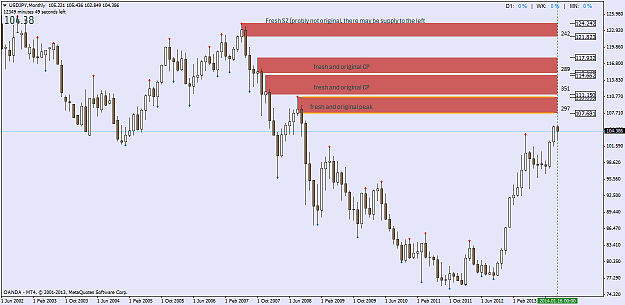
This is USDJPY monthly. Are the zones drawn correctly? What about the two in the middle - CP patterns? Would you draw them where they are? Are the bottom three ones original? I am not sure about those two at the bottom if they are considered original, because they seem like a reaction to previous SZ, although they didnt touch them. Thanks.