{quote} May I ask you to try with these three charts please? {image}{image}{image}
Ignored
Well, I'm feeling like this is a setup, but my ego isn't so fragile that I won't play-along anyway. If this isn't some sneaky trickery, then 2 doesn't look real, and out of 1 and 3 I, like red, would lean towards #3 as a real chart. I'm not sure if they are all real, none real, or some number in between, so I rank them 3 1 2 in order of my guess as to the likelihood of it being from a legit chart somewhere.
Now my winning streak of 1 will surely be crushed. I think red made it easier on me last time.
{quote} Well, I'm feeling like this is a setup, but my ego isn't so fragile that I won't play-along anyway. If this isn't some sneaky trickery, then 2 doesn't look real, and out of 1 and 3 I, like red, would lean towards #3 as a real chart. I'm not sure if they are all real, none real, or some number in between, so I rank them 3 1 2 in order of my guess as to the likelihood of it being from a legit chart somewhere. Now my winning streak of 1 will surely be crushed. I think red made it easier on me last time.
Ignored
Looking at the PA, yeah 1 and 3 look real, 2 is a bit inconsistent.
But there is another thing that i noted which hints that all 3 are real.
.
Im guessing....I don't know that for sure, but a couple of the candles I saw were consistent with a 1 or 5 minute timeframe. It could easily be an illiquid instrument. All of these exercises are good because they helped me formulate my final trading strategy. So I like to participate in stuff like this.
If you are good at something, never do it for free--Joker
Nubcake you're amazing!
The two first charts are indeed random. The third chart is G/U daily from 12/09/2011 to 03/04/2012.
I thought I could trick you with a ranging market because usually people expect a random walk to oscillate around a mean.
I also thought that you could successfully distinguish redlion's random charts because of the Normal distribution he used; that you were hinted by the lack of "fat tail effect". So I tried to mimic the market distribution as closely as possible.
Here is how I built the charts:
I took all my E/U tick database and I built an histogram of the occurences of the moves (bid_price[n]-bid_price[n-1]) at 0.1 pip resolution. Then I used this histogram as a probability distribution function. I drew samples from it to generate new ticks. For the timing I simply used the E/U ticks times: that's why the sundays bars are present and illiquid ;-). From the ticks I built the daily charts.
The samples are identically and independently distributed (iid) with the PdF of the E/U market. Since nubcake is able to spot a fake chart this means that the market is not iid.
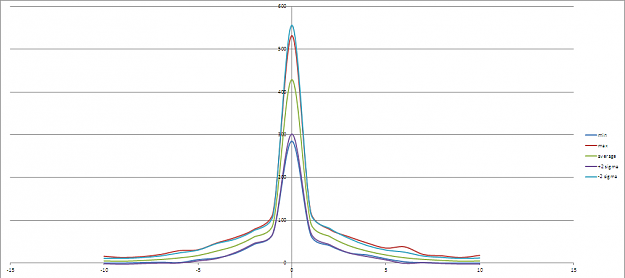
Is it identically distributed? I think no it isn't. I took 50 blocks of 1000 non-overlaping samples from my E/U M5 database. I built their 50 histograms of the pips returns. I took the average histogram, the histogram of the min and the one of the max. Clearly the distribution varies in amplitude over the time. The heteroskedasticity is clearly present.
Redlion couldn't see any autoregression up to lag 126. How can the samples be dependent without being AR(n)? ARFIMA(0,d,q)?
Nubcake you're amazing! The two first charts are indeed random. The third chart is G/U daily from 12/09/2011 to 03/04/2012. I thought I could trick you with a ranging market because usually people expect a random walk to oscillate around a mean. I also thought that you could successfully distinguish redlion's random charts because of the Normal distribution he used; that you were hinted by the lack of "fat tail effect". So I tried to mimic the market distribution as closely as possible. Here is how I built the charts: I took all my E/U tick database...
Ignored
I was still half-asleep when I got notification that I had been quoted somewhere, so it wasn't until after posting that I went back and caught-up and saw that a few others were leaning towards the same numbers. A cynical person might say I simply copied their answer.
I'm not sure I can properly put my finger on what makes some charts stand-out as more potentially real versus others. I suppose the number of bars between swings tends to gravitate around a certain number of bars, so if the chart doesn't seem to follow that basic pattern then it looks off. Plus, if a swing doesn't happen and price keeps going it looks wrong for it to not at least appear to trip some stops or something and shoot a bit further than what some of your bars were doing when they kept-on keeping as green or red for more bars than usual. Basically, a weak 'trend' is suspicious, as opposed to it popping and continuing a similar volatility, or popping and reversing. Unless it's something shitty like 1m bars in the middle of the night, in which case I'd expect to see lots of dojis or no trades at all, but maybe bits and pieces of a shitty drift which isn't a trend nor proper swinging.
Yeah, red's charts I remember being easier.
Whatever it is you eat for breakfast I want, because your math and shit is mind-boggling (or maybe I really have become dumber over the years).
Nubcake you're amazing! The two first charts are indeed random. The third chart is G/U daily from 12/09/2011 to 03/04/2012. I thought I could trick you with a ranging market because usually people expect a random walk to oscillate around a mean. I also thought that you could successfully distinguish redlion's random charts because of the Normal distribution he used; that you were hinted by the lack of "fat tail effect". So I tried to mimic the market distribution as closely as possible. Here is how I built the charts: I took...
Ignored
Do you really think you created randomness by doing this ?
{quote} Do you really think you created randomness by doing this ?
Ignored
I agree, this is not fully random because PipMeUp used previous data to compile the charts, so its more pseudo-random.Although i`m not sure how he picked the ticks, but even if he picked it fully random, if the market itself is not fully random, then no matter how randomly he picks the ticks, the result will not be random either.
And if thats the case then that number 3 chart can infact repeat in real life too, or it has been repeated already at some point.
To generate real random charts, PipMeUp should use a real random generator of 0,1 to count ticks.If 1 comes, then tick is higher than the last one, if 0 comes then tick is lower than the last one, and another random number to define how much is the distance between the new the previous tick.
Otherwise it will be a pseudorandom or even a non-randomly picked chart, just by using previous ticks data to combine a new one.
"There's a sucker born every minute" - P.T. Barnum
{quote} I agree, this is not fully random because PipMeUp used previous data to compile the charts, so its more pseudo-random.Although i`m not sure how he picked the ticks, but even if he picked it fully random, if the market itself is not fully random, then no matter how randomly he picks the ticks, the result will not be random either. And if thats the case then that number 3 chart can infact repeat in real life too, or it has been repeated already at some point. To generate real random charts, PipMeUp...
Ignored
Exactly what i am trying to say.
Pipmeup ...i am not definately as educated as you in statistics ...but true randomness cant be created by algorithm which just basically is logic based created by someone based on set of instruction.
So, i dont certainly think that you created random charts over there.
I got one better and this is for the people here who haven't read Hedge Fund Market Wizards and also on the face of people who says market are random or EMH is true for market.
Following is the interview of Edward Thorp from the books.
Can the markets be beat? Not unless you are lucky, according to proponents of the efficient market hypothesis (EMH), which assumes that the markets discount all known information and immediately reflect all new information. What about traders who have achieved exceptional track records including some of those profiled in this book? EMH believers have a ready response, which is a variant of the popular Shakespearean monkey argument— that is, if you have enough monkeys randomly striking keyboard keys (they have recently traded in their typewriters for PCs), one of them will eventually type Hamlet. By analogy, the implication is that if you have enough traders, some of them will do exceptionally well simply by chance. While the Shakespearean monkey argument is perfectly valid, the question that is always left unaddressed is:
How many monkeys would you need to get a randomly generated copy of Hamlet?
Answer: A lot of monkeys. Unimaginably more monkeys than could be squeezed into the visible universe. The relevant question then is: If trading results are based on chance, how many traders would you need to get one or more with a track record as good as one of the best actually achieved? (If EMH is correct, then all trading results are a matter of chance.) Thorp’s track record provides a useful proxy to answer this question. Thorp’s original fund, Princeton Newport Partners, ran for 19 years (November 1969 to December 1988) and had an average annualized compounded gross return of 19.1 percent (15.1 percent after fees). It is not return , but rather the extraordinary consistency of return, that sets Thorp apart. Princeton Newport Partners compiled a track record of 227 winning months and only 3 losing months (all under 1 percent)— an extraordinary 98.7 percent winning percentage. To calculate the probability of this achievement if markets were efficient, we make the simplifying assumption that the average win and average loss were equal. (This is a very conservative assumption since, in fact, Thorp’s average win was significantly higher, which implies that the probability of Thorp achieving his win percentage by chance will be even lower than the estimate we derive.) Given the assumption that the average win and loss are about equal, the probability of any single trader achieving 227 winning months (or better) out of 230 is equivalent to the probability of getting 227 or more heads in 230 coin tosses, which is approximately equal to an infinitesimally small 1 out of 10 ^63 (63 zeros after 10 ).
Even if we assume 1 billion traders, which is a deliberate exaggeration, the odds of getting at least one track record equivalent to or better than Thorp’s would still be less than 1 out of 10^62. To put this probability in context, the odds of randomly selecting a specific atom in the earth would be about a trillion times better. 1 There are two ways of looking at these results: 1. Boy, Thorp was unbelievably lucky! 2. The efficient market hypothesis is wrong.
Do you really think you created randomness by doing this ?
Not at all. I used the Mersenne Twister. It isn't cryptographically strong but it is commonly used for Monte-Carlo simulations. For the purpose of generating a random chart it is very sufficient, especially for visual inspection. Anyway I've no more radioactive material in stock
Quote
Disliked
PipMeUp should use a real random generator of 0,1 to count ticks.If 1 comes, then tick is higher than the last one, if 0 comes then tick is lower than the last one, and another random number to define how much is the distance between the new the previous tick.
This wouldn't do the trick because I would get a uniform distribution: each move would have the same probability. I wanted the same distribution as the market itself. Because I don't know its distribution I sampled from the data directly. I took the data as is. I didn't make it symetrical and I didn't smoothed it. I'm not sure this would have made a difference. I wanted to break the dependence between the ticks, being autoregressive or anything else. Nubcake did spot the fake charts because he couldn't see the "rythm" of the market. This means that there is a dependence and that the past does influence the future. At least the supply, demand, greed, fear, news... which affect the prices aren't instantenous.
{quote} Not at all. I used the Mersenne Twister. It isn't cryptographically strong but it is commonly used for Monte-Carlo simulations. For the purpose of generating a random chart it is very sufficient, especially for visual inspection. Anyway I've no more radioactive material in stock {quote} This wouldn't do the trick because I would get a uniform distribution: each move would have the same probability. I wanted the same distribution as the market itself. Because I don't know its distribution I sampled from the data directly. I took...
Ignored
nice one.
One question though.
The 2 charts you created ..Does all the candles have same number of ticks ?
The 2 charts you created ..Does all the candles have same number of ticks ?
No. For each E/U tick from my DB I kept the timestamp and the spread and I replaced the bid with a random value. This is why the sundays bars are small on the charts: they have almost no ticks inside.
The timestamps in my database have 1 second resolution. I can have 6 ticks with the same timestamp :-(
I can't perform stats on the time between two ticks.
Ok the maths in there objective state one can not question.
Lets imagine that a every force has a code of genetical make up.if only through its participation .and the only thing that interrupts that given path is the unknown variants.but what if the validity actually remains intact.the multidimensional of this market is not understood .something stoatic probabability has not yet been calculated.
The fact that the multidimensional is not considered obscures our vision.
Im more inclined to believe that this market is more non random than random . volatility obscures that prospective.
The irrational behaviour of its participants. .I believe through that erational behavour creates this random price.the enifeciancy is the correction of obscure behavour paths
Ok the maths in there objective state one can not question. Lets imagine that a every force has a code of genetical make up.if only through its participation .and the only thing that interrupts that given path is the unknown variants.but what if the validity actually remains intact.the multidimensional of this market is not understood .something stoatic probabability has not yet been calculated. The fact that the multidimensional is not considered obscures our vision. Im more inclined to believe that this market is more non random than random ....
Ignored
No, the market is fully random, but not always, thats the key point to understand, i can full random numbers and simulate ticks with it but it wont resemble the market always.Ok 1-2 candles time to time may always be random, but if we search for the ineficciency then that i`m sure its not in the randomness, but in the nonrandomness.So either be, but we must emphasize on the nonrandom part and try to work with that.
One good example of nonrandom period is right 1-2 seconds after a news report.It is reported,we know when it will come, and it always makes more or less impact on the current candlestick, so thats 100% not random.
And of course there are other ineficciencies which are more hidden.
"There's a sucker born every minute" - P.T. Barnum
|
Membership Revoked
|
Joined Aug 2006
|11,977 Posts
Candlestick patterns are formed randomly and as such should be disregarded as a trading method.
But the market is far from random, found loads of repeating patterns over the years, just finding 1's which are long term profitable is the tricky part.
Nothing to it, but to do it!!! Stick to the plan FOOL!!!!
Candlestick patterns are formed randomly and as such should be disregarded as a trading method. But the market is far from random, found loads of repeating patterns over the years, just finding 1's which are long term profitable is the tricky part.
Ignored
Not all of them, some of them are yes, but if you get the cause of why that candlestick formed, then you see the pattern there, same for chart patterns but on larger view.
For example, all the doji patterns are random , thats a fact, i just proved it a few posts earlier, but a long candle in a news report will result always in some sort of pullback to equilibrium, so a hammer or similar patterns are worth watching
"There's a sucker born every minute" - P.T. Barnum