As far as my methodology is concerned, I can't do anything with USD/CAD at the moment. The daily chart has this pair in an area of too much congestion so I'd personally wait for it to break up or down (preferably down ...I've got DVDs that want me to buy them).
Breaking down what I looked at:
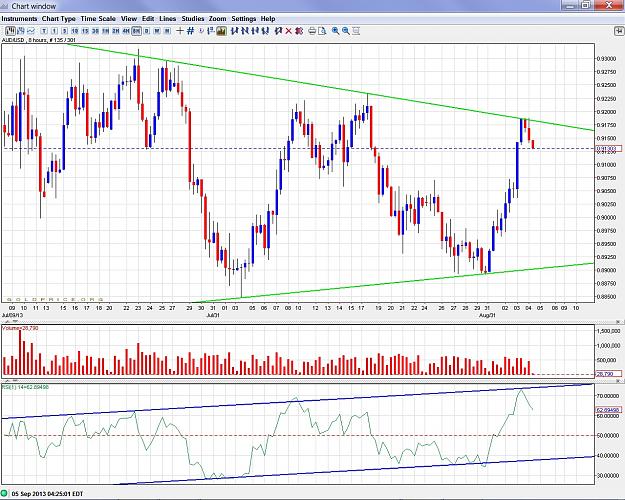
8-hour RSI is clean but it is right at support so RSI needs to either bounce or breach.
4-hour is approaching support (bearish).
2-hour just bounced off support (bullish) but it's in a narrow range.
Hourly has breached support (bearish) but that's relatively meaningless going into a long weekend.
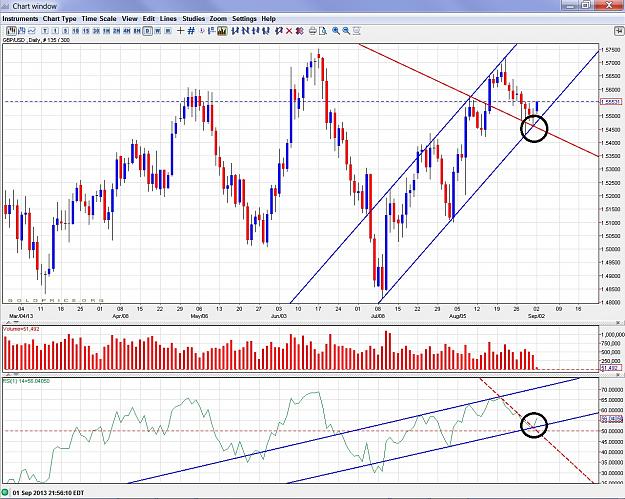
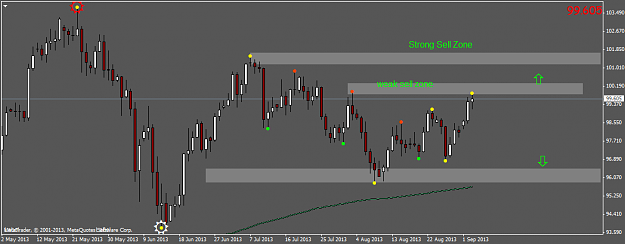
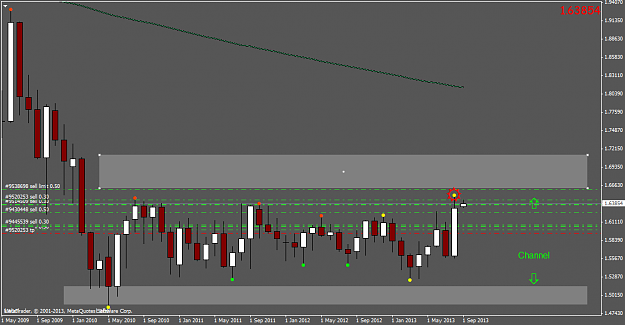
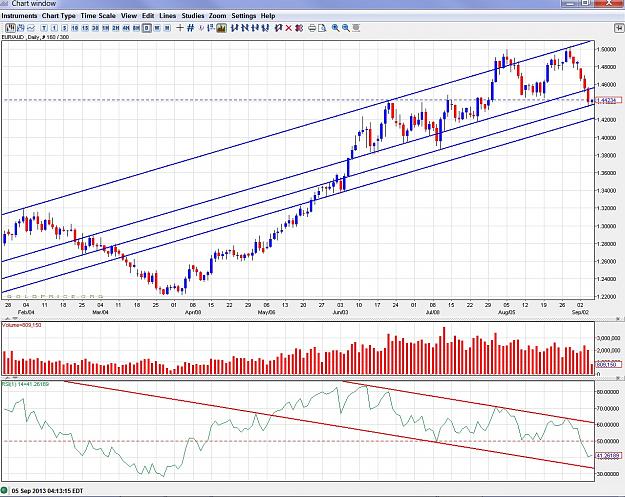
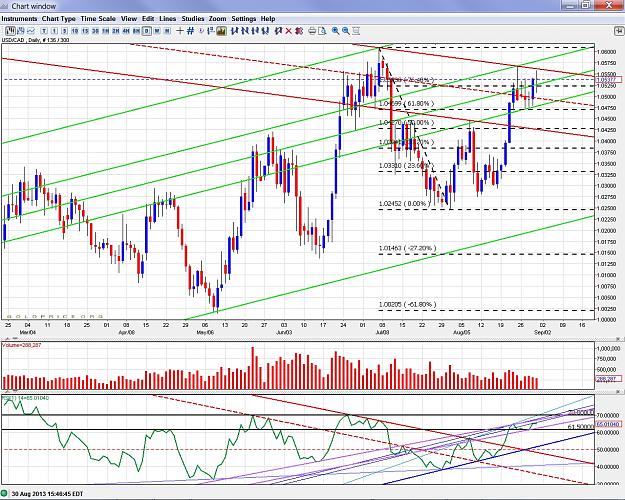
Looking at the daily chart below, the daily bear RSI trend was broken some time ago but I have no firm conviction with regard to the bull trends as the parallel to the dominant support (dark blue) diverges away from what should be the dominant resistance (light blue) and it's actually in a narrow ascending range (purple), so I'd concentrate on that purple range for now until it breaks out of it. 61.5 and 70 have been significant levels in the past and it did bounce off 61.5 which is bullish so both those levels are something to watch as well.
Taken as a whole, all the trend lines are bullish, plus RSI over 50 is a bullish indicator, so it just might break to the upside without a significant pullback (if any), but I don't like to guess.
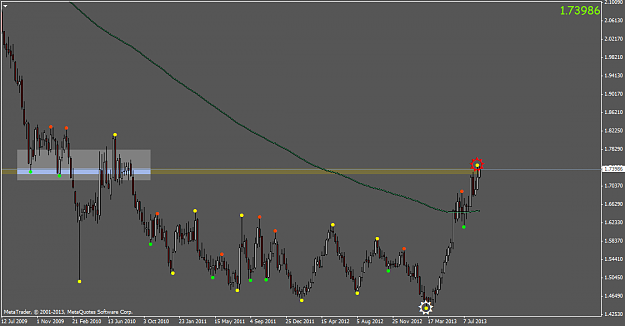
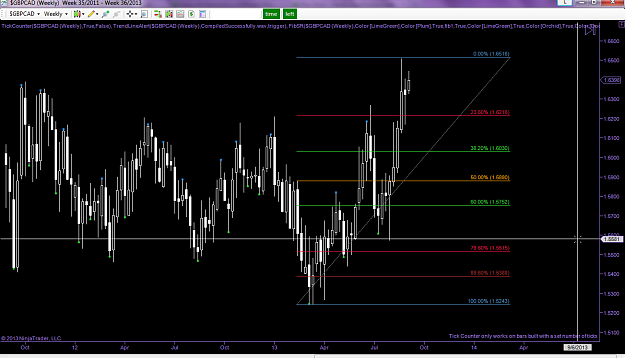
Price-wise it could be in the green bull channel drawn from the weekly chart or it could be in the red bear channel. It looks like it has ended the day with a spinning top with the body at yesterday's high which indicates a possible change of trend but we need to see Tuesday's candle (since Monday is a holiday) for confirmation. Sitting just above the 76.4% with a non-directional candle is not helping matters either.
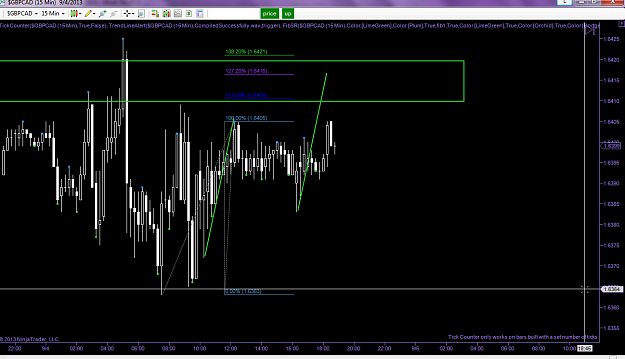
If I were forced to play USD/CAD, I would stick to scalping using 5-minute RSI trends with hourly RSI directional confirmation and stay away from any buy-and-hold strategies until I see more clarity in the daily chart.
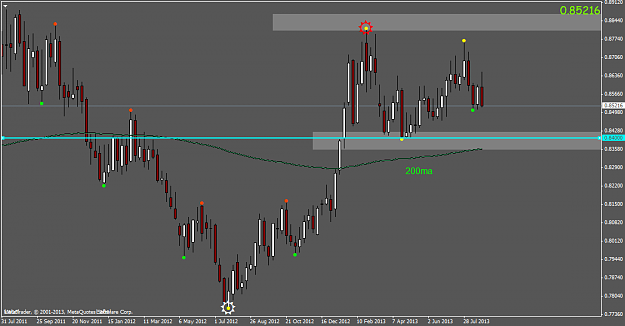
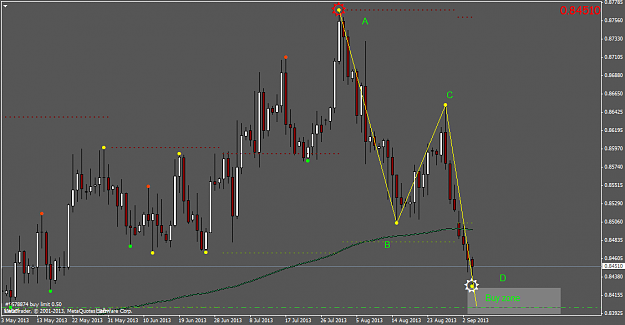
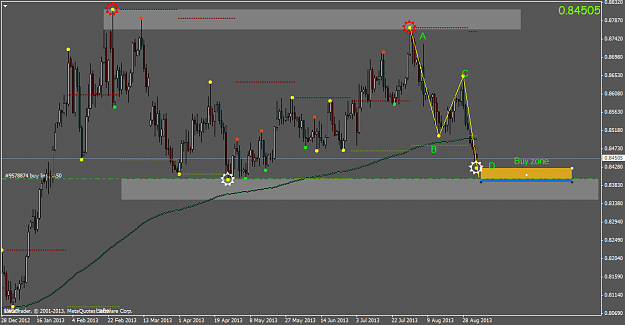
I can certainly get behind your chart and 1.07 being a sell zone. I'm a firm believer in the 1.27% extension target. It works consistently with gold for example.
Breaking down what I looked at:
8-hour RSI is clean but it is right at support so RSI needs to either bounce or breach.
4-hour is approaching support (bearish).
2-hour just bounced off support (bullish) but it's in a narrow range.
Hourly has breached support (bearish) but that's relatively meaningless going into a long weekend.
Looking at the daily chart below, the daily bear RSI trend was broken some time ago but I have no firm conviction with regard to the bull trends as the parallel to the dominant support (dark blue) diverges away from what should be the dominant resistance (light blue) and it's actually in a narrow ascending range (purple), so I'd concentrate on that purple range for now until it breaks out of it. 61.5 and 70 have been significant levels in the past and it did bounce off 61.5 which is bullish so both those levels are something to watch as well.
Taken as a whole, all the trend lines are bullish, plus RSI over 50 is a bullish indicator, so it just might break to the upside without a significant pullback (if any), but I don't like to guess.
Price-wise it could be in the green bull channel drawn from the weekly chart or it could be in the red bear channel. It looks like it has ended the day with a spinning top with the body at yesterday's high which indicates a possible change of trend but we need to see Tuesday's candle (since Monday is a holiday) for confirmation. Sitting just above the 76.4% with a non-directional candle is not helping matters either.
Attached Image (click to enlarge)
If I were forced to play USD/CAD, I would stick to scalping using 5-minute RSI trends with hourly RSI directional confirmation and stay away from any buy-and-hold strategies until I see more clarity in the daily chart.
I can certainly get behind your chart and 1.07 being a sell zone. I'm a firm believer in the 1.27% extension target. It works consistently with gold for example.
You can always make money tomorrow provided you don't lose it today.