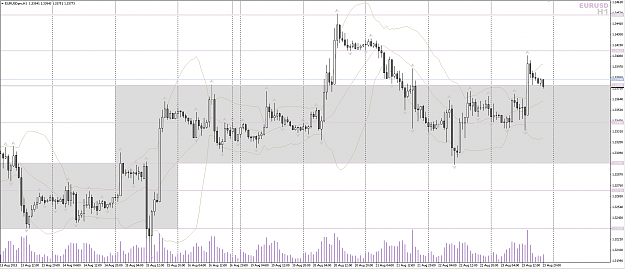
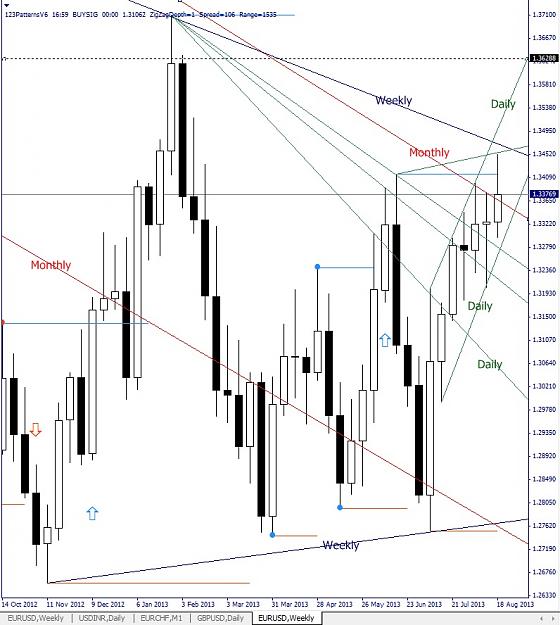
I go with something fun. Applying this "template" has always been a game for me. But I noticed, I guess you already noticed that there is much truth in this "joke." This is my reason to show this chart.
I do not see all of which is encoded in it. I do not always turn your attention to this or that. But it is very easy to "read." You can calculate the level of each line in the chart. You need the scale of the price and still the coefficient the line. All this is shown on the graph.
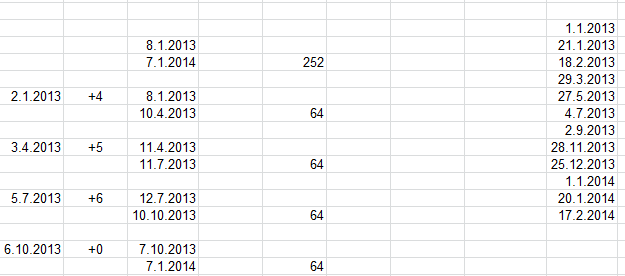
The scale of the price. It is permanent. You might remember - 15.25 pips / day. But even if you forget can be calculated. For example: 13184-13062 = 122 pips / 8 days = 15.25 pips / day. Or 13672-12695 = 977 pips / 64 days = 15.26 pips / day. Guess of rounding.
The coefficient of each line. From beginning to end each line over a measured distance by the price and at the time. Main diagonals traveled 8 divisions by the price for 8 divisions at the time. Their coefficient is 8 X 8 = 1 X 1. Line that is resistance, travels 4 divisions by the price for 8 divisions at the time. Its coefficient is 1 X 2.
Let's calculate the level of yesterday. Take the level of 20 August - 13428. And from it subtract the movement for three days. 13428 - 3 x 15.25 x (1/2) = 13405.
Attached Image (click to enlarge)
"You have to BE before you can DO, and DO before you can HAVE." Zig Ziglar