Hi,
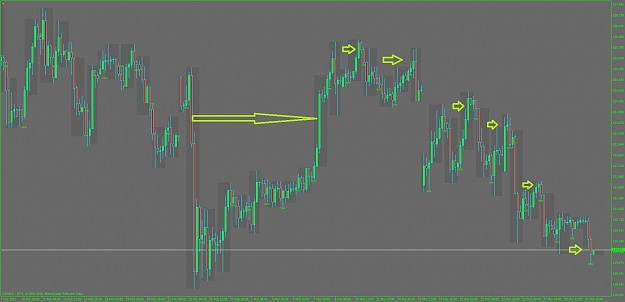
Could anyone explain what these charts mean? Do these gaps the tighter they are the strong the up/down move is. The more space there is with a weak up move = reversal is high probable?
Could anyone explain what these charts mean? Do these gaps the tighter they are the strong the up/down move is. The more space there is with a weak up move = reversal is high probable?
Attached Image (click to enlarge)
Find your Favourite Pattern