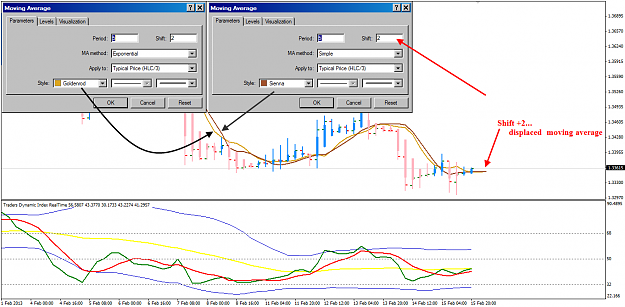
Forex Factory
  • Login

  • Username: Password:
  • 11:18pm

  • Search
  • Home

  • Forums

  • Trades

  • Calendar

  • News

  • Market

  • Brokers

Options

Search
Search
Search

Subscribe to Thread

Bookmark Thread

First Page First Unread Last Page Last Post

Printable Version

Similar Threads

Trading Made Simple for Day Charts 1499 replies

Monitor for 'Trading Made Simple' system 82 replies

Trading Made Simple EA by Guess Whom 2705 replies

Indicators for the 'Trading Made Simple' system 235 replies

  • Trading Systems
  • /
  • Reply to Thread
  • 5,789

Trading Made Simple

  • Last Post
  • First Unread
  •  
  • 1 778779Page 780781782 1044
  •  
  • Post# 15,581
  • Quote
  • Feb 13, 2013 5:12am
  • porschefan
    Joined Apr 2009 | 10 Posts | Status: Member
Quoting azizghamid
use your imaginations
see drawing

Attachment 1134299

good luck


wonderful, thanks!!!
  • Post# 15,582
  • Quote
  • Feb 13, 2013 5:16am
  • emmanuel7788
    Joined Nov 2008 | 4,324 Posts | Status: Member
Quoting borislav331
Let's read it again. Download Heiken Ashi Indicator, but this is not my yellow line appears.
The yellow line on your chart is Moving Average:

You must read all of Big E post to learn this simple system and how he trade.
Attached Image
  • Post# 15,583
  • Quote
  • Feb 13, 2013 5:48am
  • borislav331
    Joined Oct 2012 | 4 Posts | Status: Junior Member
Quoting emmanuel7788
The yellow line on your chart is Moving Average:

You must read all of Big E post to learn this simple system and how he trade.
A big thank you
  • Post# 15,584
  • Quote
  • Feb 15, 2013 3:18pm
  • redfan
    Joined Sep 2011 | 51 Posts | Status: Member
Moving Average on the chart is ( 5 period,-/shift 3,- / MA method exponential, -/
Apply to Typical price (HLC/3 )You must read all of Big E post ,
  • Post# 15,585
  • Quote
  • Feb 15, 2013 5:39pm
  • borislav331
    Joined Oct 2012 | 4 Posts | Status: Junior Member
Quoting redfan
Moving Average on the chart is ( 5 period,-/shift 3,- / MA method exponential, -/
Apply to Typical price (HLC/3 )You must read all of Big E post ,
Are you sure of what you're saying?
  • Post# 15,586
  • Quote
  • Feb 15, 2013 8:20pm
  • emmanuel7788
    Joined Nov 2008 | 4,324 Posts | Status: Member
Quoting borislav331
Are you sure of what you're saying?
Here is an important post where your will find pdf of BigE' posts and comments:
http://www.forexfactory.com/showthre...75#post5463775

whether it is 5EMA or 5SMA, there is little difference.
whether you use shift +2 or shift+3 will also not make a lot of difference.
as BigE had mentioned many times, he put more weight on TDI over the 5EMA.
you can also enter when the HA is below 5EMA so long there is a TDI cross.

It is your knowledge in Price Action and how you apply that in your trading that will make a huge difference whether you can achieve and maintain consistent trade results.

Regards,
Attached Image (click to enlarge)
Click to Enlarge

Name: TMS 5EMA vs 5SMA.png
Size: 45 KB
  • Post# 15,587
  • Quote
  • Feb 16, 2013 11:50am
  • Nellycopter
    Joined Jan 2013 | 62 Posts | Status: Member
As a newbie myself and decided to start out using this method,
What would be the necessities to learn ?
Just price action, or other things like chart patterns, fibs etc ?
As the author said, keep it simple....... But just how simple ??

Nelly .
  • Post# 15,588
  • Quote
  • Feb 16, 2013 1:24pm
  • Britpip7 ● Online
    Joined Apr 2011 | 1,049 Posts | Status: "Never Give Up - Never Surrender"
Quoting emmanuel7788
Here is an important post where your will find pdf of BigE' posts and comments:
http://www.forexfactory.com/showthre...75#post5463775

whether it is 5EMA or 5SMA, there is little difference.
whether you use shift +2 or shift+3 will also not make a lot of difference.
as BigE had mentioned many times, he put more weight on TDI over the 5EMA.
you can also enter when the HA is below 5EMA so long there is a TDI cross.

It is your knowledge in Price Action and how you apply that in your trading that...
Just a comment on how the 5EMA was used. Originally Big E used it as a confirmation of PA, so for long trades, a candle breaking the 5EMA with a TDI cross was an entry signal. As he evoloved the approach, the 5EMA criteria was dropped in favour of PA and Support / Resistance levels. It was left on the charts purely as a visual aid / crutch for trend directions.

Essentially the trend direction can be taken from the TDI - The mid Zone line above 50 is a confirmation that the trend direction is positive - below 50 - negative.

Predominant approach id APB colour change and TDI cross occurring within one or two candles. Watch for S/R levels and the 200EMA. If TDI is hovering around the 50 level, wait for PA to confirm any TDI break - lots of false signals.

If the Day TDI is above 68 / below 32, look for reversal signals / TDI divergence / convergence, or drop down to lower time frames where TDI is not oversold / overbought. Avoid entering long of TDI>68 or <32.

PA is king, so a good understanding of candles and their patterns is essential. When back testing, find the really good entries and understand what PA was doing with regards to S/R levels and 200EMA.
  • Post# 15,589
  • Quote
  • Feb 17, 2013 10:48am
  • teofil00
    Joined Dec 2012 | 39 Posts | Status: Member
I have successfully used TDI on 2 of my demo accounts...

How ever...

One has to know the support,resistance and news announcements. There are many times the green line crosses the red line yet failing to see the support and resistance when the market is ranging will make you lose the trade.

TDI works best when pairs are not ranging that much.

This is my experience so far.
  • Post# 15,590
  • Quote
  • Feb 17, 2013 2:55pm
  • Yuri57
    Joined Nov 2012 | 78 Posts | Status: busy taking your cash
I didn't read the whole thread but looking at the charts I trade somewhat similar but let me point out a few things:

You don't need oscillators, they are useless. They are derivatives of moving averages. Use 200-50-20-10 EMA instead, they work as support-resistance. (If not the trend is weak).

When you enter a trade you never know how much it will go in your favour or against you. This is why you should GET OUT the moment it goes against you (you should define what noise is, but Heiken Ashi is a great tool to simplify that).

So ignore all the bullsh!t, all predictions are futile just get in sync with the market stay on the "right side" and you will make money.

Works in every time-frame.
  • Post# 15,591
  • Quote
  • Feb 17, 2013 6:41pm
  • akaky
    Joined Feb 2013 | 5 Posts | Status: Member
Hey dotless - forgive my number of posts - I seem to have misplaced my original username. I have been demoing TMS and other TDI type systems. But I have not come across the idis you are using on this post. Which indi shows the arrows? thanks for the help.
Quoting dotless
hi all!

This indicator is so awesome. I've just started demo trading on it and at first, I was losing money because I wasn't setting stop losses and was interfering too much so what I did was to open a position and minimize the trading platform.
Now, I'm doing much better. Making 4 successive trades so far.

Btw, take a look at the chart. Would you have closed the position?
  • Post# 15,592
  • Quote
  • Feb 18, 2013 2:38am
  • emmanuel7788
    Joined Nov 2008 | 4,324 Posts | Status: Member
Quoting Yuri57
I didn't read the whole thread but looking at the charts I trade somewhat similar but let me point out a few things:

You don't need oscillators, they are useless. They are derivatives of moving averages. Use 200-50-20-10 EMA instead, they work as support-resistance. (If not the trend is weak).

When you enter a trade you never know how much it will go in your favour or against you. This is why you should GET OUT the moment it goes against you (you should define what noise is, but Heiken Ashi is a great tool to simplify that)....

if oscillators are derivative of moving averages, what are moving averages derived from?
moving averages will always follow price, not the other way around.
at some point in time, both the price and its moving average will meet.
to make money, you must be in the market.

BULLs will make money.
BEARS will make money.
only pigs get slaugthered.
Attached Image (click to enlarge)
Click to Enlarge

Name: bullshit you must bear.png
Size: 437 KB
  • Post# 15,593
  • Quote
  • Feb 18, 2013 2:43am
  • emmanuel7788
    Joined Nov 2008 | 4,324 Posts | Status: Member
Quoting akaky
Hey dotless - forgive my number of posts - I seem to have misplaced my original username. I have been demoing TMS and other TDI type systems. But I have not come across the idis you are using on this post. Which indi shows the arrows? thanks for the help.
Hi akaky,

those arrows look like TDI cross and Stochastic cross to me.
what do you think?
  • Post# 15,594
  • Quote
  • Feb 18, 2013 2:46am
  • emmanuel7788
    Joined Nov 2008 | 4,324 Posts | Status: Member
Quoting Britpip7
Just a comment on how the 5EMA was used. Originally Big E used it as a confirmation of PA, so for long trades, a candle breaking the 5EMA with a TDI cross was an entry signal. As he evoloved the approach, the 5EMA criteria was dropped in favour of PA and Support / Resistance levels. It was left on the charts purely as a visual aid / crutch for trend directions.

Essentially the trend direction can be taken from the TDI - The mid Zone line above 50 is a confirmation that the trend direction is positive - below 50 - negative.

Predominant approach...
Thanks David for the followup and explaining more into details. Very much appreciated that you did so.
I am sure may new traders to this systems will leanr these well.

Regards,
  • Post# 15,595
  • Quote
  • Feb 18, 2013 2:34pm
  • redfan
    Joined Sep 2011 | 51 Posts | Status: Member
HI i am new to this site please can you tell me which one is the mid Zone line ? is it the yellow line in the TDI.
  • Post# 15,596
  • Quote
  • Feb 18, 2013 4:34pm
  • Britpip7 ● Online
    Joined Apr 2011 | 1,049 Posts | Status: "Never Give Up - Never Surrender"
Quoting redfan
HI i am new to this site please can you tell me which one is the mid Zone line ? is it the yellow line in the TDI.
The three TDI lines that are of interest for TMS are (see chart):

Red: Trade Signal Line
Green: RSI Price Line - this is the one that crosses the red for entry signals supported by PA
Blue: Mid Zone - above the 50 level is showing an up trend, below the 50 line is showing a down trend

General rule - above 68, don't enter long - below 32, don't enter short

A Must Read is Post #1 on this thread and the referenced threads form that post.

Also read as many posts as you can from Eelfranz / X-Man / Emmanuel778 / PHX62 / dcginc / Vantage / dee50
Attached Image (click to enlarge)
Click to Enlarge

Name: tms - tdi.gif
Size: 31 KB
  • Post# 15,597
  • Quote
  • Feb 18, 2013 11:34pm
  • erickva
    Joined Jun 2011 | 29 Posts | Status: Member
Hi All,

Is BigE still following his thread?
It's been a while since his last post.
I hope he is alright.

Cheers,
Erick
  • Post# 15,598
  • Quote
  • Feb 19, 2013 12:02am
  • Britpip7 ● Online
    Joined Apr 2011 | 1,049 Posts | Status: "Never Give Up - Never Surrender"
Quoting erickva
Hi All,

Is BigE still following his thread?
It's been a while since his last post.
I hope he is alright.

Cheers,
Erick
Big E has passed away, but his teachings remain with us
  • Post# 15,599
  • Quote
  • Feb 19, 2013 12:10am
  • erickva
    Joined Jun 2011 | 29 Posts | Status: Member
oh, thanks David.
I was fearing that answer would come. I remember he was not very well.
God bless him and his family, he did good! Thank you BigE!! RIP.
  • Post# 15,600
  • Quote
  • Feb 19, 2013 10:25am
  • snarlyjack
    Joined Feb 2008 | 518 Posts | Status: mountain standard time
Hey Guy's and Gal's:

I've been e-mailed by some members in the past regarding this system so I thought I'd pop in and give you my
impression of the system. I've been trading it for about 5 years now.

I met Eelfranz back in (2008) while studying a system called "secrets of stochastics, by redtrader" which went into
Craig Harris system of Stochastics (2009) which went into the beginning, putting together the system of
trading made simple (2009/2010). Eelfranz has since died of diabetes. He was from Portland, Or. USA.
I'am from Montana, USA and the London market doesn't open until 12:00 a.m. our time. Both Eelfranz and
I could not stay up all night to trade the London markets so Trading Made Simple on the 4 hour charts were
born. Guess what, we all started making lot's of money! Since then their have been some spin-off's. X-Man
SSS system and Trading made simple for daily charts. And another simple trading system on the
15 minute chart. All of these are basically the same system using the TDI indicator, but different time charts.
The system is very good and really the only system that I have made money with.

A little about myself. I have been able to retire and trade to make my money. I can't seem to stay-up
all night to trade the London market so I like to set my trades on the 4 hour chart and go to bed and
check things in the morning. 80% of the time I make money. I set my stop loss about 3 candles back
at the hi/low and go to bed. I have studied indicators and charts for hours/months years... I'am at the
point in my life that I just want to set my trade and go out and ride motorcycles and live life. I think that
forex and indicators are very random and I want to get away from all the noise. Trading Made Simple by
Eelfranz works and is very profitable. In my opinion Eelfranz did everyone at forex factory a hugh favor
before he died. (His memory lives on...thanks Eelfranz... RIP).

If I could give someone some advice. I would go into the history here at forex factory and study everything
that Eelfranz has written. In the mean time their have been some people who have stepped-up to really
help the new traders. I can't mention everyone by name but you know who you are...thanks. Myself
I'am not a good teacher. I don't have the time or the patience for it. And the people who are teaching
this method are much better at it than I. But know this...this system as laid out by Eelfranz...works and
is very profitable. Spend your time learning this system and you'll be well rewarded...especially the 1 hour
and 4 hour charts. (Especially the 4 hour chart-that's the secret...tdi on the 4 hour chart).

Well I hope I helped someone. Good trading to everyone. I'll try to keep in touch every once in awhile...

Love

snarlyjack
Thread Tools Search this Thread
Show Printable Version Show Printable Version
Email This Thread Email This Thread
Search this Thread:

Advanced Search

  • Trading Systems
  • /
  • Trading Made Simple
  • Reply to Thread
    • 1 778779Page 780781782 1044
13 traders viewing now, 5 are members: rob Miller, mykaelboy, Coast101, Kerigan, fupeter
  • More

©2013 Forex Factory, Inc. / Terms of Use / Privacy Policy

Forex Factory® is a registered trademark.

Connect

  • Facebook
  • Twitter
  • RSS

Company

  • About FF
  • FF Blog
  • Careers at FF
  • Advertising
  • Contact FF

Products

  • Forums
  • Trades
  • Calendar
  • News
  • Market
  • Brokers
  • Trade Explorer

Website

  • Homepage
  • Search
  • User Guide
  • Member List
  • Online Now
  • Report a Bug