DislikedCan someone please clear confluence mentioned in Rules of Engagement of ABCD pattern which is as follows:
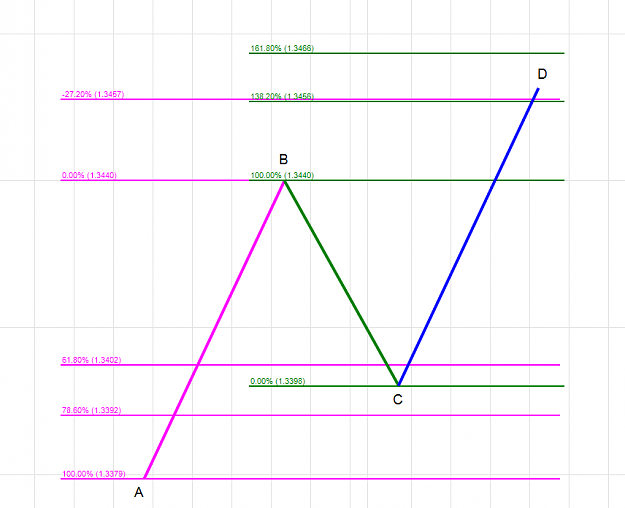
The market forms the (D) completion point by fulfilling at least a one to one harmonic move of the AB leg coming in at a 127.2% extension of AB. For ratio confluence confirmation a measurement of the BC may be taken and the extension should come in at around a 138.2% to a 161.8%.
I have highlighted the the confluence, can some one explain with example or in simple terms...
Thanks,
AliIgnored
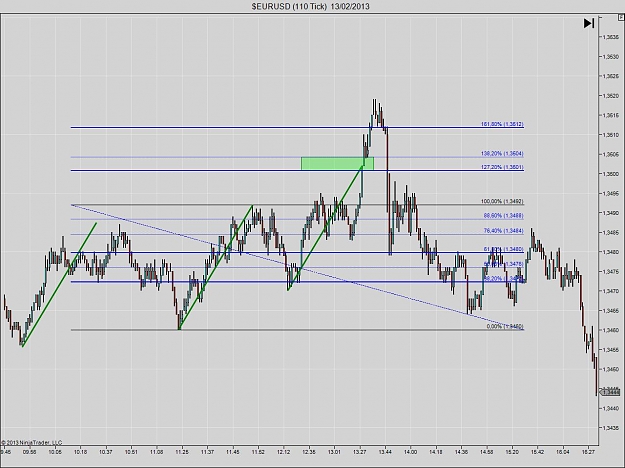
You are interested in where the 138.2 and 161.8% extensions are in relation to the 127.2% extension of AB (shown as -27.20% on this chart), and the AB=CD completion point.
Take a look at the green lines on this chart
Attached Image (click to enlarge)