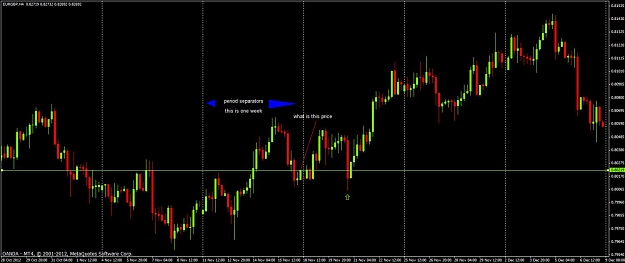
DislikedI hope I'm not being dense here, and I don't want to be lazy. I've taken a look for "market structure" and the best I came up with was a subsection on market highs and lows on this page. Looking at the times for closes doesn't seem to help either, as neither line seems to be based off of a London close at 11 EST.
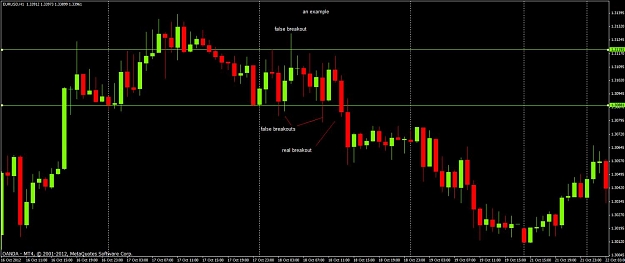
From 9/14 to 9/17 it acted as a supply level on the first chart, and actually it did react as expected on the next touch, although it was a short lived bear rally. The new chart, I see another...Ignored
Also London closes at 12 eastern.
Search order flow on this site and you can find some good papers to study if google doesn't turn up much. This is hard to find as it is gold and not easily given up.
Attached Image (click to enlarge)