Forex Factory
  • Login

  • Username: Password:
  • 3:44pm

  • Search
  • Home

  • Forums

  • Trades

  • Calendar

  • News

  • Market

  • Brokers

Options

Search
Search
Search

Subscribe to Thread

Bookmark Thread

First Page First Unread Last Page Last Post

Printable Version

Similar Threads

Broker Challenge "NDD/STP" vs. True "ECN" and "Mkt Mkr" broker talk 45 replies

  • Trading Systems
  • /
  • Reply to Thread
  • 429

The gg53 "Killing Zone"

  • Last Post
  • First Unread
  •  
  • 1 7172Page 737475 92
  •  
  • Post# 1,441
  • Quote
  • Jan 2, 2013 7:34am
  • jjibl
    Joined Sep 2007 | 59 Posts | Status: Member
Can you explain with an example this indicator, please.
Regards
Julio

Quoting DmitryFX
Hi, G!

I have been following to your thread since it was started.
And I want to express my respect for your ideas and it's very useful realisation by indicators.
I have found OBV is VERY useful. And now, its "Market Statistics"...
In this case I want to share anothere one very useful in my mind indi.
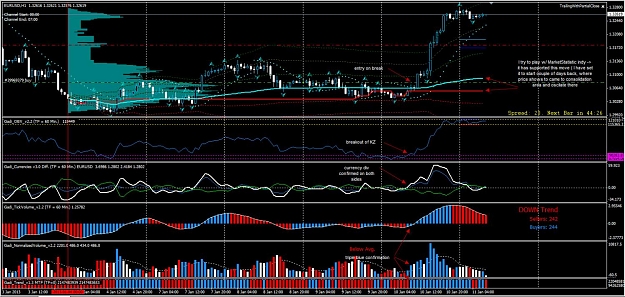
This indi works with historical dates based on m1 chart. It's drawing some kind S/R levels based on the most volumes.
Check, its very clear.
  • Post# 1,442
  • Quote
  • Jan 2, 2013 8:51am
  • DmitryFX
    Joined Nov 2011 | 514 Posts | Status: the probability trader
I hope my explanation will be clear.
If not, then sorry.
Attached Image (click to enlarge)
Click to Enlarge

Name: tpo range explaining.gif
Size: 31 KB
Everything is possible!!!
  • Post# 1,443
  • Quote
  • Jan 2, 2013 3:43pm
  • jjibl
    Joined Sep 2007 | 59 Posts | Status: Member
Thank´s your explanation is clear
Redards
Julio
Quoting DmitryFX
I hope my explanation will be clear.
If not, then sorry.
Attachment 1108521
  • Post# 1,444
  • Quote
  • Jan 4, 2013 6:00pm
  • jusiur
    Joined Oct 2010 | 313 Posts | Status: Member
If you followed the GG advice regarding Market Statistics (VWAP/PVP/PA/SD . . .) and is convinced that the concept is an excellent tool for volume trading, be sure to visit THIS akiff thread.
  • Post# 1,445
  • Quote
  • Jan 7, 2013 2:36am
  • nevmar
    Joined Jun 2009 | 14 Posts | Status: Member
Hi GG53 Jusiur and followers thanks for all the work & effort.
I hope everyone will have a pipping & a healthy new year.
DimitryFX is there a chance of finding the author or a write up on the use of the +TPO indie.
How are the dashed blue & red vertical lines used, their positions can be swapped on the chart.
If this was on the MQL mt4 the author would give an explicit explanation of it use etc
Thanks for posting it.
Kind regards
Nev
  • Post# 1,446
  • Quote
  • Jan 7, 2013 2:55am
  • DmitryFX
    Joined Nov 2011 | 514 Posts | Status: the probability trader
Quoting jusiur
If you followed the GG advice regarding Market Statistics (VWAP/PVP/PA/SD . . .) and is convinced that the concept is an excellent tool for volume trading, be sure to visit THIS akiff thread.
summary document from AKIF
Attached File
File Type: doc Trading With Market Statistics.doc   415 KB | 229 downloads
Everything is possible!!!
  • Post# 1,447
  • Quote
  • Jan 7, 2013 2:59am
  • nevmar
    Joined Jun 2009 | 14 Posts | Status: Member
DimitryFX
Dont worry I have found what I need, its a pity its all in Russian but will translate with Google.
Thanks again for the TPO
regards
Nev
  • Post# 1,448
  • Quote
  • Jan 7, 2013 4:05am
  • DmitryFX
    Joined Nov 2011 | 514 Posts | Status: the probability trader
Quoting nevmar
DimitryFX
Dont worry I have found what I need, its a pity its all in Russian but will translate with Google.
Thanks again for the TPO
regards
Nev
Ask if any doubt.
Everything is possible!!!
  • Post# 1,449
  • Quote
  • Jan 7, 2013 5:08am
  • Rifouly
    Joined Sep 2011 | 24 Posts | Status: Member
I want to post some charts.
And hope to see some charts from other users.

I use the gadi with 15 min chart.
I dont know why its in Black and white?
Attached Image (click to enlarge)
Click to Enlarge

Name: euraud15min.jpg
Size: 133 KB
  • Post# 1,450
  • Quote
  • Jan 7, 2013 5:12am
  • Rifouly
    Joined Sep 2011 | 24 Posts | Status: Member
AUDCHF15min

I exit my Trades with this rules.

Exit for Longs: When the gadi brakes a Higher Low
Exit Shorts: When gadi brakes a Lower High
Attached Image (click to enlarge)
Click to Enlarge

Name: audchf15min.jpg
Size: 128 KB
  • Post# 1,451
  • Quote
  • Jan 8, 2013 8:36am
  • Visari
    Joined Oct 2012 | 25 Posts | Status: Member
People that read this thread should post occasionally so this thread is always active!

Has anyone been experimenting with the divergence indicator? Looking back at where it has signals, it does seem very useful, though I am yet to use it in a live situation which I'll be trying out over the next few days.
  • Post# 1,452
  • Quote
  • Jan 8, 2013 5:27pm
  • Hammondnz
    Joined May 2012 | 15 Posts | Status: Member
Quoting Visari
People that read this thread should post occasionally so this thread is always active!

Has anyone been experimenting with the divergence indicator? Looking back at where it has signals, it does seem very useful, though I am yet to use it in a live situation which I'll be trying out over the next few days.
Hi Visari

Thanks for the reminder!
I downloaded the indis sometime over the holiday break and then promptly forgot about them.
Will have a look when I get home form work this afternoon.

Regards to all and happy new year!

Graham
  • Post# 1,453
  • Quote
  • Jan 9, 2013 4:37am
  • whydak
    Joined Apr 2012 | 11 Posts | Status: Member
Sometimes even I got lucky :-)
Attached Image (click to enlarge)
Click to Enlarge

Name: GBPJPY_M15.jpg
Size: 140 KB
  • Post# 1,454
  • Quote
  • Jan 9, 2013 8:15am
  • Visari
    Joined Oct 2012 | 25 Posts | Status: Member
I find the currencies divergence indicator to be the best...

I have all 3 open in MT4 and where all 3 seem to give the same signal within a bar or two of each other I find the most success.

In a couple of days I'm getting another monitor as I've lost my main one and will be back trading and hopefully post a few examples of how to use them. I'm still working them out but I think they are really good.

By the way, to everyone reading this, I've been giving the market statistics linked by gg back a couple of pages a serious read and it's really good... I definitely think it will improve everyone's trading! I like the indicator and find it pretty helpful too.
  • Post# 1,455
  • Quote
  • Jan 9, 2013 9:49pm
  • jusiur
    Joined Oct 2010 | 313 Posts | Status: Member
because of GG, now I confess to be a fan of the volume trading, do not miss this Spudfire´s very interesting thread.
  • Post# 1,456
  • Quote
  • Jan 9, 2013 11:29pm
  • alij79
    Joined Feb 2012 | 87 Posts | Status: Member
gg can you please upload currency divergence indicator with "suffix" option, i think you forgot to do it as earlier you said will upload it soon.....

will appreciate if you can do it early....

thanks..
  • Post# 1,457
  • Quote
  • Jan 11, 2013 1:40am
  • kapybara
    Joined Aug 2010 | 131 Posts | Status: Member
Happy new year and lot of pips in 2013

Happy to catch yesterdays' moves.

AU_4H -> I have entered on triple blue confirmation (1st triple blue missed, so I still was able to enter on 2nd triple blue confirmation at the same price). I know I was in KZ, but I decided to take it considering support of Daily TF

EU_1H -> see annotations in screen shot

I decided to hold these positions, when looking at higher TFs

Guys/gals please keep this thread alive by posting (ideas, trades taken, just contribute...). I cannot wait to soak more and more wisdom from GG (and of course from all of you)
Attached Images (click to enlarge)
Click to Enlarge

Name: AU_4H.jpg
Size: 173 KB Click to Enlarge

Name: EU_1H.jpg
Size: 189 KB
  • Post# 1,458
  • Quote
  • Jan 12, 2013 2:37am
  • Visari
    Joined Oct 2012 | 25 Posts | Status: Member
wow real nice, great examples.

I've been playing with the divergence indicators but at least for me, the dots that show the movements tend to only appear on the indicator a few bars after they have occurred. Meaning, there is a movement, nothing is shown on the first close, or the second, but after the third bar since the move opens, a red or yellow dot 2 or 3 bars back might appear...

Maybe I'm wrong but I've not seen a dot appear right before the current bar as would be most useful. I'm guessing it's because of how it is calculated?
  • Post# 1,459
  • Quote
  • Jan 12, 2013 4:18pm
  • BlackStack
    Joined Jan 2010 | 146 Posts | Status: Member
Quoting Visari
wow real nice, great examples.

I've been playing with the divergence indicators but at least for me, the dots that show the movements tend to only appear on the indicator a few bars after they have occurred. Meaning, there is a movement, nothing is shown on the first close, or the second, but after the third bar since the move opens, a red or yellow dot 2 or 3 bars back might appear...

Maybe I'm wrong but I've not seen a dot appear right before the current bar as would be most useful. I'm guessing it's because of how it is calculated?

I agree that the dots come later. Seems sort of like a fractal indicator where it will take a few more bars to know that was the max or min point.
  • Post# 1,460
  • Quote
  • Jan 14, 2013 1:36am
  • BlackStack
    Joined Jan 2010 | 146 Posts | Status: Member
I hope gg53 did not take that broker job.

Thread Tools Search this Thread
Show Printable Version Show Printable Version
Email This Thread Email This Thread
Search this Thread:

Advanced Search

  • Trading Systems
  • /
  • The gg53 "Killing Zone"
  • Reply to Thread
    • 1 7172Page 737475 92
0 traders viewing now
  • More

©2013 Forex Factory, Inc. / Terms of Use / Privacy Policy

Forex Factory® is a registered trademark.

Connect

  • Facebook
  • Twitter
  • RSS

Company

  • About FF
  • FF Blog
  • Careers at FF
  • Advertising
  • Contact FF

Products

  • Forums
  • Trades
  • Calendar
  • News
  • Market
  • Brokers
  • Trade Explorer

Website

  • Homepage
  • Search
  • User Guide
  • Member List
  • Online Now
  • Report a Bug