Forex Factory
  • Login

  • Username: Password:
  • 12:28pm

  • Search
  • Home

  • Forums

  • Trades

  • Calendar

  • News

  • Market

  • Brokers

Options

Search
Search
Search

Subscribe to Thread

Bookmark Thread

First Page First Unread Last Page Last Post

Printable Version

  • Interactive Trading
  • /
  • Reply to Thread
  • 3,375

Trend Trading All Pairs

  • Last Post
  • First Unread
  •  
  • 1 601602Page 603604605 609
  •  
  • Post# 12,041
  • Quote
  • Dec 26, 2012 10:43am
  • NightMoves
    Joined Dec 2007 | 2,580 Posts | Status: Trading the Trends
Quoting hytten
Thanks forexmnstr and NM.

NM,

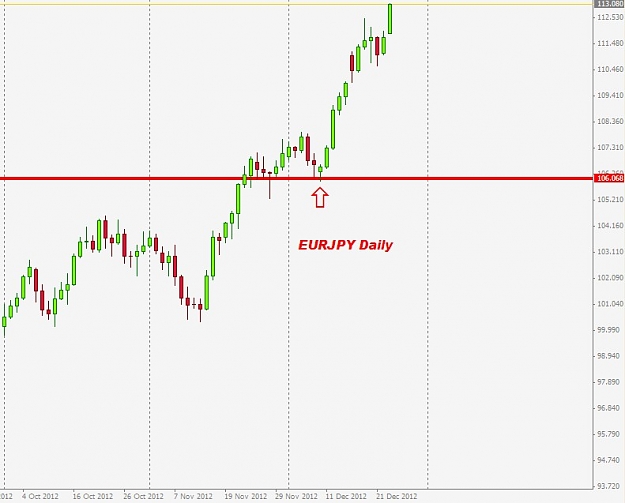
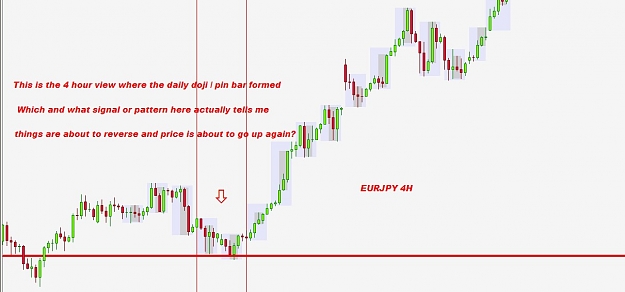
Emm May I know if you were watching this, which lower timeframe reversal signals would you taking your trade from? 1H or 4H? Should I jump in if I see a pin bar on 1H at the previously broken support OR wait for the 4H candle to close? Sometimes the bounce is not as clear as 1 single candle or 2 candle reversal.. if it is moving sideways before it falls again how would I know? wait for the break of range and pull back?
When I use my setup charts that is the chart I place all my trend lines on, and anything I am using to determine the area I am looking for a reversal or an entry spot area. Then I zoom into a smaller time frame to get a better look and that is where I look for reversals. On the daily chart the pullback never stopped. It looks to me (correct me if I am wrong) as if you used the same TF to determine your BPC and used one bar to make that decision.

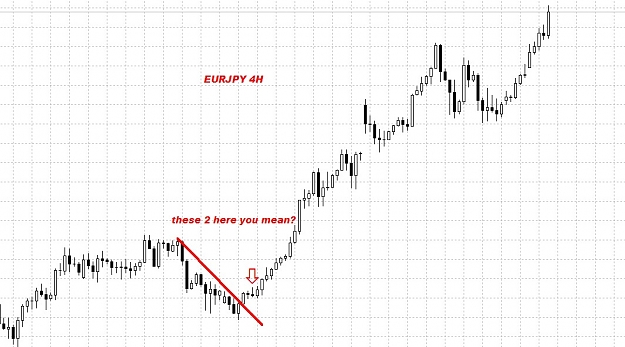
I like to see about 3 or 4 bar pullback and the continuation on a smaller time frame. You dont want to zoom in so far that it no longer makes sense, meaning that if you trade the daily chart you do not want to use the 30 minute chart as a trigger chart. I like to use a 4 time frame or so smaller chart, for example, if I trade the daily chart then if I divide that by 4 I would get 6 hours, use the chart that gets as close to that as I can.

If you trade the hourly chart, 60 min/ 4 = 15min time frame would be my trigger. That should give you an idea of how I determine my trigger time frame. Again you just want to make sure you dont go to small or the signals become useless and really nothing but noise.

I like to see around 3 or 4 bars of pullback I dont want anymore than 5 at the most anymore than that and I scrap the setup.

Hope that helps some.

--NM
  • Post# 12,042
  • Quote
  • Dec 26, 2012 10:58am
  • hytten
    Joined Jul 2009 | 87 Posts | Status: Member
Quoting NightMoves
When I use my setup charts that is the chart I place all my trend lines on, and anything I am using to determine the area I am looking for a reversal or an entry spot area. Then I zoom into a smaller time frame to get a better look and that is where I look for reversals. On the daily chart the pullback never stopped. It looks to me (correct me if I am wrong) as if you used the same TF to determine your BPC and used one bar to make that decision.

--NM
Yes you are right, I use the same TF and that one bar to make that decision. Part time strategy as I understood it is that we trade that time frame without zooming down to smaller time frame.. emm perhaps it was meant for weekly chart.. i will check again.

I've attached 2 charts. Daily and 4H. Please help explain what on the 4H that give me a hint that things is about to stall and start to move up again?

Thanks
Attached Images (click to enlarge)
Click to Enlarge

Name: ScreenHunter_06 Dec. 26 23.41.jpg
Size: 46 KB Click to Enlarge

Name: ScreenHunter_07 Dec. 26 23.53.jpg
Size: 71 KB
  • Post# 12,043
  • Quote
  • Dec 26, 2012 11:07am
  • NightMoves
    Joined Dec 2007 | 2,580 Posts | Status: Trading the Trends
Quoting hytten
Yes you are right, I use the same TF and that one bar to make that decision. Part time strategy as I understood it is that we trade that time frame without zooming down to smaller time frame.. emm perhaps it was meant for weekly chart.. i will check again.

I've attached 2 charts. Daily and 4H. Please help explain what on the 4H that give me a hint that things is about to stall and start to move up again?

Thanks
hytten,

The 4 hour chart shows the trigger point, price bounced off the resistance line, and headed back up, then there was 2 bar pullback and then the continuation. You want at least 2 bars on your trigger and no more than 5 in my opinion. That is your entry signal. That 4 hour chart shows it quite clear.

--NM
  • Post# 12,044
  • Quote
  • Dec 26, 2012 11:09am
  • NightMoves
    Joined Dec 2007 | 2,580 Posts | Status: Trading the Trends
Quoting hytten
Yes you are right, I use the same TF and that one bar to make that decision. Part time strategy as I understood it is that we trade that time frame without zooming down to smaller time frame.. emm perhaps it was meant for weekly chart.. i will check again.

I've attached 2 charts. Daily and 4H. Please help explain what on the 4H that give me a hint that things is about to stall and start to move up again?

Thanks
I dont have my editing software on this computer yet or I would circle the area on your chart. But that is a very good setup and a good entry point. They dont always look that clean but if the trend is strong you have the market on your side its a pretty safe trade.

--NM
  • Post# 12,045
  • Quote
  • Dec 26, 2012 11:18am
  • hytten
    Joined Jul 2009 | 87 Posts | Status: Member
Quoting NightMoves
I dont have my editing software on this computer yet or I would circle the area on your chart. But that is a very good setup and a good entry point. They dont always look that clean but if the trend is strong you have the market on your side its a pretty safe trade.

--NM
I kinda wish you have your editing tools with you too haha.. coz I have no idea which are the candles you are referring too.. By chance is the 2 red bar after the break of the retrancement trendline? BTW the bounce that you look for, it is after the daily candle close showing a clear bounce say in a form of pin bar then you zoom to 4H the following day to look for entry OR 4H before we even know the daily candle is going to close as a pin bar?
Attached Image (click to enlarge)
Click to Enlarge

Name: ScreenHunter_01 Dec. 27 00.23.jpg
Size: 141 KB
  • Post# 12,046
  • Quote
  • Dec 26, 2012 11:43am | Edited at 12:51pm
  • NightMoves
    Joined Dec 2007 | 2,580 Posts | Status: Trading the Trends
Quoting hytten
I kinda wish you have your editing tools with you too haha.. coz I have no idea which are the candles you are referring too.. By chance is the 2 red bar after the break of the retrancement trendline? BTW the bounce that you look for, it is after the daily candle close showing a clear bounce say in a form of pin bar then you zoom to 4H the following day to look for entry OR 4H before we even know the daily candle is going to close as a pin bar?
Right where your arrow is at is the pullback. That is what you are looking for, then once the continuation clears the spot where the pull back started is where you enter. The pin bar on the daily is good to let you know something is happening in the area of concern, the 4 hour trigger chart is where you make your decision to go or not to go. I like to draw a retracement trend as well and will use that as well, I will wait for it to break that line. In a sideways market I wait for a channel break and look for the BPC. Sometimes you can miss a trade waiting for full BPC but thats ok too, at least there nothing lost, I would rather have a good BPC rather than try and predict, and the BPC is about as good of indicator as you can get.

I am not a wild trader I need everything to come together just they I want it to, if it does not then I skip it and wait for the next. I dont have to be in every trade. I only want to be in the HIGH probability trades...

--NM
  • Post# 12,047
  • Quote
  • Dec 26, 2012 11:51am
  • NightMoves
    Joined Dec 2007 | 2,580 Posts | Status: Trading the Trends
Quoting hytten
I kinda wish you have your editing tools with you too haha..
I am still setting this computer up so hopefully within the next day or so I should have all my software installed and ready to go again. Then I can post good descriptive charts again.

--NM
  • Post# 12,048
  • Quote
  • Dec 30, 2012 1:39pm
  • pipnut
    Joined Dec 2009 | 153 Posts | Status: Member
Quoting hytten
Please help, I do not know what I did wrong.

AUDNZD Daily. It appears to me like the breakout and the inverted hammer tested the broken support now acting as resistance. A breakout pull back continuation to me. So what is wrong with my analysis?
hytten,

Looks like NightMoves has helped you out quite a bit so I don't know if this "left side of the chart" analysis will help you but here are my thoughts:

From your post it I am assuming you were looking to make a short entry and it didn't work out. If you look at the attached chart you will see the area just below your entry was at a point that previously turned the market back from a downtrend as an area of Support. You might have found a better shorting entry by waiting for prices to break through this congestion area and return to retest the bottom as Resistance. As it turned out the market hit this area just after the continuation Pin Bar you were looking at and reversed again.

There are other Pin Bars marked on the chart with points of confluence indicated as well. The second was somewhat weak in appearance and trading back into a congestion area at the 200 SMA but had good confluence and set up the following downward move.

Best wishes to you!

pipnut
Attached Image (click to enlarge)
Click to Enlarge

Name: 12.28.12 audnzd pin.gif
Size: 37 KB
Even a blind squirrel finds a nut sometime.
  • Post# 12,049
  • Quote
  • Dec 30, 2012 2:13pm
  • pipnut
    Joined Dec 2009 | 153 Posts | Status: Member
Quoting hytten
Hi NM,

I took it from daily chart itself. I attached a screen shot from Hector's course. I kinda see the entry as similar to breakout congestion continuation. Is it not the same?
hytten,

Is this from Hector's newer course? This part time trading method appears to be based on Price Action at Support and Resistance and Daily time frame trading? It doesn't appear like you are using any MA's with this technique as his older course included.

thanks,

pipnut
Even a blind squirrel finds a nut sometime.
  • Post# 12,050
  • Quote
  • Dec 30, 2012 2:40pm
  • pipnut
    Joined Dec 2009 | 153 Posts | Status: Member
Quoting NightMoves
Right where your arrow is at is the pullback. That is what you are looking for, then once the continuation clears the spot where the pull back started is where you enter. The pin bar on the daily is good to let you know something is happening in the area of concern, the 4 hour trigger chart is where you make your decision to go or not to go. I like to draw a retracement trend as well and will use that as well, I will wait for it to break that line. In a sideways market I wait for a channel break and look for the BPC. Sometimes you can miss a trade...
NightMoves,

Great to see you posting on the thread again! It's always a pleasure reading your comments.

I have a "left side of the chart" look at the eurjpy that I have attached with some notes. I saw a Weekly Trend line that was broken on 11/22 with a close above on the 23rd. A Pin Bar on the 28th tested this Trend line and the 106.00 BRN but was rejected. Would you consider that a BPC of the breakout? The second Pin Bar that you were discussing also tested the 106.00 and was again rejected just prior to the move upwards.

Also want to wish you and everyone on this thread a Happy New Year!

pipnut
Attached Image (click to enlarge)
Click to Enlarge

Name: 12.28.12 eurjpy pin.gif
Size: 29 KB
Even a blind squirrel finds a nut sometime.
  • Post# 12,051
  • Quote
  • Dec 30, 2012 10:53pm
  • hytten
    Joined Jul 2009 | 87 Posts | Status: Member
Quoting NightMoves
I am still setting this computer up so hopefully within the next day or so I should have all my software installed and ready to go again. Then I can post good descriptive charts again.

--NM
Thanks NM.
  • Post# 12,052
  • Quote
  • Dec 30, 2012 11:06pm
  • hytten
    Joined Jul 2009 | 87 Posts | Status: Member
Quoting pipnut
hytten,

Is this from Hector's newer course? This part time trading method appears to be based on Price Action at Support and Resistance and Daily time frame trading? It doesn't appear like you are using any MA's with this technique as his older course included.

thanks,

pipnut
Pipnut,

You are right. The 3SMA now is free. The new course consist of, 3SMA, Part Time trading (mainly on higher timeframe with not trigger chart), LOB and Market Flow. Hector also has a paid forum with daily broadcast as well with his assistant Jacob. The best thing about the service is that you will get Hector's trendlines auto drawn to your chart daily
  • Post# 12,053
  • Quote
  • Jan 4, 2013 8:34pm
  • frog316
    Joined Jan 2013 | 4 Posts | Status: Member
I just started trading this method as described by Nightmoves in the beginning of this thread. I still have a long way to go but you need to start somewhere.

After trading for one month so far here are my observations:
- Spending a lot of screen time on the charts, often my eyes begin to hurt
- I sometimes am overwhelmed with so many currency pairs. I monitor 15 pairs (not all the Hector pairs)
- I do set alarms but even after it's triggered you still have to wait for the BPC price action.
- Need to work on patience waiting for the best setups.
- Trade with the trend (duh) and don't trade unless there is a trend.

I trade starting at 8am New York time up until I go to bed. (I like to sleep and don't want to wake up for London).

- December results: + 81 pips

I'm just beginning my FX career and with so much information out there on FF, I'm trying to stick solely with this one trading method (KISS). However, does anyone recommend trading two "systems" at the same time? (I'm thinking of supplementing this with another long term trading strategy based off 4hr TF and up) Thanks a lot and hope to see this thread continue, and possibly a Nightmoves return.
  • Post# 12,054
  • Quote
  • Jan 5, 2013 2:13pm
  • Custos
    Joined Dec 2006 | 3,553 Posts | Status: Member
Quoting frog316
I just started trading this method as described by Nightmoves in the beginning of this thread. I still have a long way to go but you need to start somewhere.

After trading for one month so far here are my observations:
- Spending a lot of screen time on the charts, often my eyes begin to hurt
- I sometimes am overwhelmed with so many currency pairs. I monitor 15 pairs (not all the Hector pairs)
I think you are doing something wrong, if you are overwhelmed by 15 pairs. Which time-frame are you trading?
Quoting frog316
- I do set alarms but even after it's triggered you still have to wait for the BPC price action.
well, if you can do some programming, then you can instruct a software to wait for the bpc and then enter automatically.

Quoting frog316
- Need to work on patience waiting for the best setups.
- Trade with the trend (duh) and don't trade unless there is a trend.
yeah, good attitude


Quoting frog316
I trade starting at 8am New York time up until I go to bed. (I like to sleep and don't want to wake up for London).
No problem with that, however, I would then only trade the 4hour chart or higher. Intraday is best when you can trade during london (at least with this technique)

Quoting frog316
- December results: + 81 pips
Pips are irrelevant, I would look at the return: ending balance / beginning balance

Quoting frog316
I'm just beginning my FX career and with so much information out there on FF, I'm trying to stick solely with this one trading method (KISS). However, does anyone recommend trading two "systems" at the same time? (I'm thinking of supplementing this with another long term trading strategy based off 4hr TF and up) Thanks a lot and hope to see this thread continue, and possibly a Nightmoves return.
trading two systems is only good if their results are not correlated, so if you used another trend following system, then you have no advantage really. I would rather search for either a profitable contrarian, non-directional system or a system based on fundies. However, not that easy to find.
  • Post# 12,055
  • Quote
  • Jan 5, 2013 9:00pm
  • frog316
    Joined Jan 2013 | 4 Posts | Status: Member
Custos, thanks for the reply.

I've been making entries using the 15 min, 30 min, and 1 hr TF and I have been monitoring 6 pairs on my screen at a time.

After thinking about it I'll just stick with this system and focus more on the higher TF and pick the best trending pairs. Keep it simple.

I've been trading only 1 micro lot for each trade and will increase only when I am consistent and comfortable over a long period of time. My SL's have been above the pullback (anywhere from 15 to 30 pips or so) and I've been exiting trades at a minimum of 1:1 to 1:2 RR. As of now I'm placing my TP's at the next RN (1.400, 1.450, 1.500 ect) or areas of S/R.
  • Post# 12,056
  • Quote
  • Jan 6, 2013 3:54am
  • rosaferno
    Joined Dec 2009 | 62 Posts | Status: Member
Shomari, custos, skynet, all the gurus and noob alike, lets keep this thread alive......wishing u all pipful new year.
i trust my system, only my broker i distrust
  • Post# 12,057
  • Quote
  • Jan 6, 2013 8:56am
  • Custos
    Joined Dec 2006 | 3,553 Posts | Status: Member
Quoting frog316
Custos, thanks for the reply.

I've been making entries using the 15 min, 30 min, and 1 hr TF and I have been monitoring 6 pairs on my screen at a time.
My experience in the beginning has been: All the pips I made in the higher time-frames, I gave back in the lower time-frames. My suspicion is that it has something to do with program trading / high frequency trading, which exploit intraday behavior and stops people out constantly. However, maybe I am also not skilled enough .
Quoting frog316
After thinking about it I'll just stick with this system and focus more on the higher TF and pick the best trending pairs. Keep it simple.
Since you are fairly new, get yourself a program called "Forex Tester". The program basically looks like metatrader and downloads all historical data for the past 10 years. Now the difference between metatrader and this program is that it allows you to "replay" price action of the last 10 years, which makes forward testing rather easy on past price action. You can forward test any strategy and speed up price action to any speed you like. Best is you just look at it and see if it is useful for you. In terms of forward testing discretionary strategies, I've found it rather useful.
Quoting frog316
I've been trading only 1 micro lot for each trade and will increase only when I am consistent and comfortable over a long period of time. My SL's have been above the pullback (anywhere from 15 to 30 pips or so) and I've been exiting trades at a minimum of 1:1 to 1:2 RR. As of now I'm placing my TP's at the next RN (1.400, 1.450, 1.500 ect) or areas of S/R.
well, I think this is a philosophical question, but I think it's not good to keep the lot size constant. Let's say, you are trading the same lot-size for 3 months, you are comfortable with it and decide to go in with higher lot-size. Now a whole new dimension of psychological problems will occur. You are not used to the size of wins and losses this higher lot-size will bring and you become very emotional about it possibly screwing up your plan. I would rather already incorporate a systematic increase/decrease of the lot-size depending on your account balance, e.g. 1% of the account size. Or you reset the lot-size once a week or once a month, but it should always be the same percentage of your account size.
If you have troubles of becoming profitable in the beginning, then I would increase the minimum required R:R to 1:2 or higher. Will get you in less trades, but profitability would go up eventually, cause 1. your probabilities per trade stay the same, but 2. the payout increases for each trade, due to the asymmetric risk reward.
Don't place tp's at the next RN or S/R, place it a bit before them. price sometimes stops shortly before reaching the RN or S/R.
  • Post# 12,058
  • Quote
  • Jan 6, 2013 10:05am
  • rosaferno
    Joined Dec 2009 | 62 Posts | Status: Member
Quoting Custos
My experience in the beginning has been: All the pips I made in the higher time-frames, I gave back in the lower time-frames. My suspicion is that it has something to do with program trading / high frequency trading, which exploit intraday behavior and stops people out constantly. However, maybe I am also not skilled enough .

Since you are fairly new, get yourself a program called "Forex Tester". The program basically looks like metatrader and downloads all historical data for the past 10 years. Now the difference between metatrader and this...
spot on bro. For me I have started with a 1000dollars demo account, I risk 1percent per trade, adjust the lot size based on my stop loss value , at the end I only risk 10dollars for every trade, irrespective of the lot size. I use earnforex position size calculator, 50pips, 70pips stoploss dont matter, as long as the risk in terms of dollar remains the same.
i trust my system, only my broker i distrust
  • Post# 12,059
  • Quote
  • Jan 6, 2013 10:14am
  • frog316
    Joined Jan 2013 | 4 Posts | Status: Member
Excellent advice again, much appreciated.
  • Post# 12,060
  • Quote
  • Jan 18, 2013 12:31am
  • rkr81
    Joined Aug 2012 | 93 Posts | Status: Member
Attached Image (click to enlarge)
Click to Enlarge

Name: chfjpy.JPG
Size: 66 KB


Took long chfjpy pair on daily time frame
Thread Tools Search this Thread
Show Printable Version Show Printable Version
Email This Thread Email This Thread
Search this Thread:

Advanced Search

  • Interactive Trading
  • /
  • Trend Trading All Pairs
  • Reply to Thread
    • 1 601602Page 603604605 609
0 traders viewing now
  • More

©2013 Forex Factory, Inc. / Terms of Use / Privacy Policy

Forex Factory® is a registered trademark.

Connect

  • Facebook
  • Twitter
  • RSS

Company

  • About FF
  • FF Blog
  • Careers at FF
  • Advertising
  • Contact FF

Products

  • Forums
  • Trades
  • Calendar
  • News
  • Market
  • Brokers
  • Trade Explorer

Website

  • Homepage
  • Search
  • User Guide
  • Member List
  • Online Now
  • Report a Bug