Forex Factory
  • Login

  • Username: Password:
  • 7:03pm

  • Search
  • Home

  • Forums

  • Trades

  • Calendar

  • News

  • Market

  • Brokers

Options

Search
Search
Search

Subscribe to Thread

Bookmark Thread

First Page First Unread Last Page Last Post

Printable Version

Similar Threads

EA using candles 8 replies

EA with Candles 3 replies

Candles- What do they mean 5 replies

MA Candles 1 reply

I need more candles! 4 replies

  • Trading Systems
  • /
  • Reply to Thread
  • 945

Beyond the Candles

  • Last Post
  • First Unread
  •  
  • 1 4445Page 464748 64
  •  
  • Post# 901
  • Quote
  • Dec 19, 2012 12:35am
  • sodiska
    Joined Nov 2011 | 61 Posts | Status: Member
You are right. Wise words, appreciate it. I will have to practice and practice. Thanks.
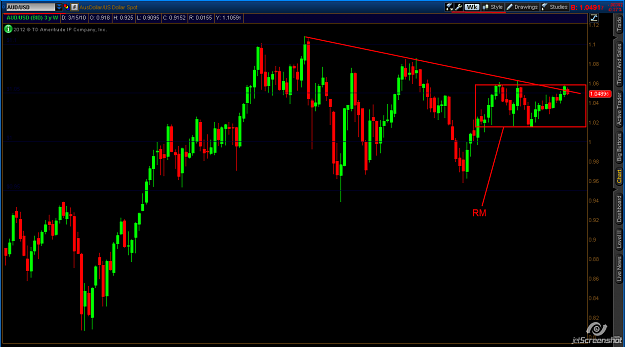
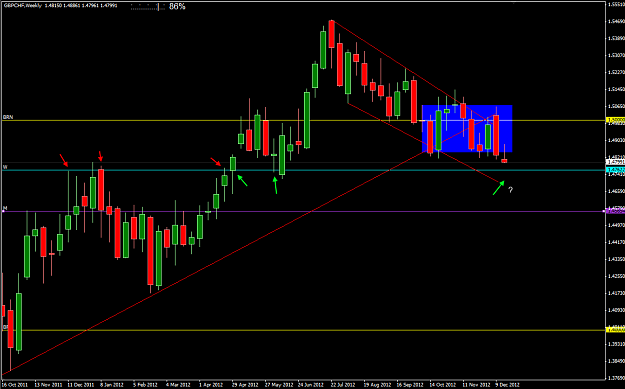
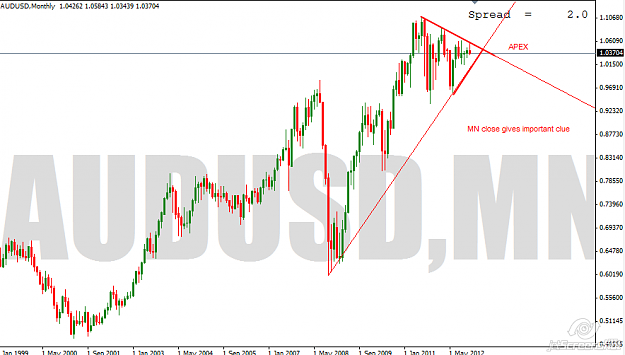
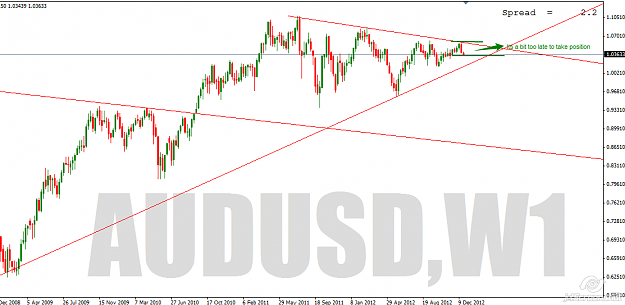


Quoting dfumagalli
What price is doing is the more important. If WPD is doing stuff through a triangle, then the triangle is more important because that's what price wants to play with.
But in the end that's for you to decide, where I see a triangle and plan my trade accordingly, you could see something else and you should plan accordingly. Well made plans will usually work somewhat, even if you did not "get" exactly what price was about to do, only when you don't make or respect a plan then you lose big time.
  • Post# 902
  • Quote
  • Dec 19, 2012 10:41am
  • sodiska
    Joined Nov 2011 | 61 Posts | Status: Member
Hi FxGroup,

There is a triangle in AUDUSD monthly. In weekly, P is not able to close above the trendline. If P reject the trendline and also close below weekly support, wait for daily to enter short, and target TP at 1.023. What do you think?
Attached Image (click to enlarge)
Click to Enlarge

Name: audusd_weekly.gif
Size: 20 KB
  • Post# 903
  • Quote
  • Dec 19, 2012 3:25pm
  • fxgroup
    Joined Nov 2010 | 753 Posts | Status: Member
[quote=sodiska;6308922]
Quote
Hi FxGroup,

There is a triangle in AUDUSD monthly. In weekly, P is not able to close above the trendline. If P reject the trendline and also close below weekly support, wait for daily to enter short, and target TP at 1.023. What do you think?
Well spotted the TL....the confluence between the TL and the 1.05 BRN is very important ! Before consider a short within the RM be sure of the sellers confirmation of 2 R levels ( TL+ BRN ) !
Attached Image (click to enlarge)
Click to Enlarge

Name: 2012-12-19_21-21_AUD-USD.png
Size: 50 KB
Nothing personal,just business.
  • Post# 904
  • Quote
  • Dec 20, 2012 7:33am
  • msmarple
    Joined Oct 2008 | 825 Posts | Status: Is that true ?
Here a monthly and weekly chart of EURAUD, we can see very well WPD - the hesitant ranging behaviour on Daily for some time looks totally simple and efficient on Weekly.

Happy Holidays to you all, especially to fxgroup and dfumagalli !

Welcome to all new readers and a good 2013 for all of you !

Michael
Attached Images (click to enlarge)
Click to Enlarge

Name: 2012-12-20_1314_EURAUD_M.png
Size: 28 KB Click to Enlarge

Name: 2012-12-20_1319_EURAUD_W.jpg
Size: 67 KB
  • Post# 905
  • Quote
  • Dec 22, 2012 11:05am
  • chuongio
    Joined Oct 2012 | 43 Posts | Status: Member
hi fxgroup , everybody
i thinks about GBP/CHF. Can you help me about it?
Attached Images (click to enlarge)
Click to Enlarge

Name: 1.JPG
Size: 94 KB Click to Enlarge

Name: 2.JPG
Size: 80 KB
  • Post# 906
  • Quote
  • Dec 23, 2012 9:19am
  • dfumagalli
    Joined Aug 2010 | 196 Posts | Status: Roaring in a cave near you
Quoting chuongio
hi fxgroup , everybody
i thinks about GBP/CHF. Can you help me about it?
Hello,
your setup might work perfectly but I am not going to take it.


Attachment 1: weekly chart.

look at how the bearish channel support is in the way, along with a quite potent weekly (cyan) level.


Attachment 2: daily chart.

Big buyers vs sellers fight = broken bones = stay out.
Also, the last bar did not form any price action pattern (well, it formed a possible 3 bars low but that requires caution) and failed to close below (and thus invalidate) the first, bullish controlling bar (that is, a bar that gives the "tune" to the subsequent bars till it's dominion is broken).
Attached Images (click to enlarge)
Click to Enlarge

Name: 2012-12-23_GBPCHF_W_01.png
Size: 41 KB Click to Enlarge

Name: 2012-12-23_GBPCHF_D_01.png
Size: 51 KB
  • Post# 907
  • Quote
  • Dec 24, 2012 5:05am
  • fxgroup
    Joined Nov 2010 | 753 Posts | Status: Member
I wish all of you merry christmas and a very happy new year !
Nothing personal,just business.
  • Post# 908
  • Quote
  • Dec 24, 2012 1:13pm
  • chuongio
    Joined Oct 2012 | 43 Posts | Status: Member
Quoting fxgroup
I wish all of you merry christmas and a very happy new year !
hi fxgroup and everybody
thanks you very much. I also wish all of you merry christmas and a very happy new year
Attached Image
  • Post# 909
  • Quote
  • Dec 25, 2012 4:06am
  • Dariusz
    Joined Jul 2011 | 121 Posts | Status: Member
Merry Christmas and Healthy in New Year and remember PT&TP
Attached Image
"Patience is bitter, but its fruit is sweet" Jean-Jacques Rousseau .
  • Post# 910
  • Quote
  • Dec 25, 2012 10:26am
  • sodiska
    Joined Nov 2011 | 61 Posts | Status: Member
Hi FxGroup,

Attached is the daily AUDUSD. Purple line is monthly support/resistance and trendline, yellow is the weekly. Since P close below the weekly support, this I think confirms short opportunity. I am planning to enter below 1.04139 with target at 1.023. What's your though on this?


[quote=fxgroup;6309717]
Quoting sodiska

Well spotted the TL....the confluence between the TL and the 1.05 BRN is very important ! Before consider a short within the RM be sure of the sellers confirmation of 2 R levels ( TL+ BRN ) !
Attached Image (click to enlarge)
Click to Enlarge

Name: audusd_weekly.gif
Size: 17 KB
  • Post# 911
  • Quote
  • Dec 25, 2012 11:25am
  • dfumagalli
    Joined Aug 2010 | 196 Posts | Status: Roaring in a cave near you
Quoting sodiska
Hi FxGroup,

Attached is the daily AUDUSD. Purple line is monthly support/resistance and trendline, yellow is the weekly. Since P close below the weekly support, this I think confirms short opportunity. I am planning to enter below 1.04139 with target at 1.023. What's your though on this?

If you enter on a RET W then the target should also be W (that is, short term). Imo you are late to the downtrend and there are some potentially dangerous swings and RM to the left.

Finally, you are missing about 30% worth of analysis room by plotting a quite unneded ATR squiggly line.
  • Post# 912
  • Quote
  • Dec 25, 2012 8:25pm
  • sodiska
    Joined Nov 2011 | 61 Posts | Status: Member
Hi, thanks for the reply. Can you advice, when was the best time to enter since I am late for this trade?


Quoting dfumagalli
If you enter on a RET W then the target should also be W (that is, short term). Imo you are late to the downtrend and there are some potentially dangerous swings and RM to the left.

Finally, you are missing about 30% worth of analysis room by plotting a quite unneded ATR squiggly line.
  • Post# 913
  • Quote
  • Dec 26, 2012 2:18pm
  • Dariusz
    Joined Jul 2011 | 121 Posts | Status: Member
AUSUSD MN

We have to wait till mn confirmation.
MN, W, D looks dwn, but we need Dec close.
Attached Image (click to enlarge)
Click to Enlarge

Name: 2012-12-26_20-15_AUSUSD_MN.png
Size: 28 KB
"Patience is bitter, but its fruit is sweet" Jean-Jacques Rousseau .
  • Post# 914
  • Quote
  • Dec 26, 2012 7:50pm
  • sodiska
    Joined Nov 2011 | 61 Posts | Status: Member
Hi, thanks for the info. But, dfumagalli has the opinion that its already late for entry. Are you having different view from dfumagalli? Am trying to understand the rationale for the analysis.


Quoting Dariusz
AUSUSD MN

We have to wait till mn confirmation.
MN, W, D looks dwn, but we need Dec close.
  • Post# 915
  • Quote
  • Dec 26, 2012 8:31pm
  • sodiska
    Joined Nov 2011 | 61 Posts | Status: Member
Hi,

I am looking at another setup at GBPNZD. Purple is monthly S/R, brown is weekly. P is in weekly RM, and doji is formed at weekly support. I take that as a clue to say P is rejecting the upward momentum at 1.9768. In daily chart, notice there are 3 doji for the past 3 days. I take that as signal to enter P below 1.9768 with target at monthly support at 1.9296. Any feedback is welcome.
Attached Images (click to enlarge)
Click to Enlarge

Name: gbpnzd_weekly.jpg
Size: 127 KB Click to Enlarge

Name: gbpnzd_daily.jpg
Size: 133 KB
  • Post# 916
  • Quote
  • Dec 27, 2012 2:09am
  • Dariusz
    Joined Jul 2011 | 121 Posts | Status: Member
Quoting sodiska
Hi, thanks for the info. But, dfumagalli has the opinion that its already late for entry. Are you having different view from dfumagalli? Am trying to understand the rationale for the analysis.
We have the same view on this setup and as You see from W perspective it might be to late as price moved half way in triangle, so now we have to wait to see reaction on APEX and confirmation after leaving it.
Attached Image (click to enlarge)
Click to Enlarge

Name: 2012-12-27_08-04_AUSUSD_W.png
Size: 32 KB
"Patience is bitter, but its fruit is sweet" Jean-Jacques Rousseau .
  • Post# 917
  • Quote
  • Dec 27, 2012 3:29am
  • fxgroup
    Joined Nov 2010 | 753 Posts | Status: Member
Quoting Dariusz
AUSUSD MN

We have to wait till mn confirmation.
MN, W, D looks dwn, but we need Dec close.
Hi Dariusz

This is an advanced interpretation of the M chart with the DOJI candle as controlling.....beeing a doji that means we have a RM between the limits (high and low) of the doji candle.
The W shows us a RM with a DBHLC @ the R ....we have to be carefull= MM at a very important level within the RM as in my chart !
Attached Images (click to enlarge)
Click to Enlarge

Name: 2012-12-27_AUM.png
Size: 47 KB Click to Enlarge

Name: AUW.png
Size: 46 KB
Nothing personal,just business.
  • Post# 918
  • Quote
  • Dec 27, 2012 8:46am
  • sodiska
    Joined Nov 2011 | 61 Posts | Status: Member
Well, seems I make wrong analysis, the doji is not consider a doji until weekly is close. Damn, need to wake up.


Quoting sodiska
Hi,

I am looking at another setup at GBPNZD. Purple is monthly S/R, brown is weekly. P is in weekly RM, and doji is formed at weekly support. I take that as a clue to say P is rejecting the upward momentum at 1.9768. In daily chart, notice there are 3 doji for the past 3 days. I take that as signal to enter P below 1.9768 with target at monthly support at 1.9296. Any feedback is welcome.
  • Post# 919
  • Quote
  • Dec 27, 2012 9:04am
  • msmarple
    Joined Oct 2008 | 825 Posts | Status: Is that true ?
Thank you fxgroup, here is my close-up of AUDUSD Weekly and its level, at least we had a close below 1.0400.

My best wishes to all of you for 2013 !

Best of health, peace and prosperity.


============
Michael
Attached Image (click to enlarge)
Click to Enlarge

Name: 2012-12-27_1501_AUDUSD_W.jpg
Size: 184 KB
  • Post# 920
  • Quote
  • Dec 29, 2012 4:01pm
  • dfumagalli
    Joined Aug 2010 | 196 Posts | Status: Roaring in a cave near you
Happy new year to everyone!
Thread Tools Search this Thread
Show Printable Version Show Printable Version
Email This Thread Email This Thread
Search this Thread:

Advanced Search

  • Trading Systems
  • /
  • Beyond the Candles
  • Reply to Thread
    • 1 4445Page 464748 64
2 traders viewing now, 1 is a member: iulianpojar
  • More

©2013 Forex Factory, Inc. / Terms of Use / Privacy Policy

Forex Factory® is a registered trademark.

Connect

  • Facebook
  • Twitter
  • RSS

Company

  • About FF
  • FF Blog
  • Careers at FF
  • Advertising
  • Contact FF

Products

  • Forums
  • Trades
  • Calendar
  • News
  • Market
  • Brokers
  • Trade Explorer

Website

  • Homepage
  • Search
  • User Guide
  • Member List
  • Online Now
  • Report a Bug