Forex Factory
  • Login

  • Username: Password:
  • 7:34am

  • Search
  • Home

  • Forums

  • Trades

  • Calendar

  • News

  • Market

  • Brokers

Options

Search
Search
Search

Subscribe to Thread

Bookmark Thread

First Page First Unread Last Page Last Post

Printable Version

Similar Threads

Traditional MACD histograms vs MT4's MACD Coding 8 replies

Help with MACD & MA of MACD Cross indicator 0 replies

no MACD line on MT4 MACD indicator 1 reply

Donchian Trend Monster 9 replies

  • Trading Systems
  • /
  • Reply to Thread
  • 151

BMI - MacD Magic Monster

  • Last Post
  • First Unread
  •  
  • 1 910Page 111213 16
  •  
  • Post# 201
  • Quote
  • Dec 23, 2012 12:42pm
  • sabrys5769 ● Online
    Joined Jun 2010 | 210 Posts | Status: Member
Quoting BlueMental
I worked very hard to get my IQ up to 7 I must say! If I had one more brain cell, it would be lonely. But at least it is overqualified to be a politician.

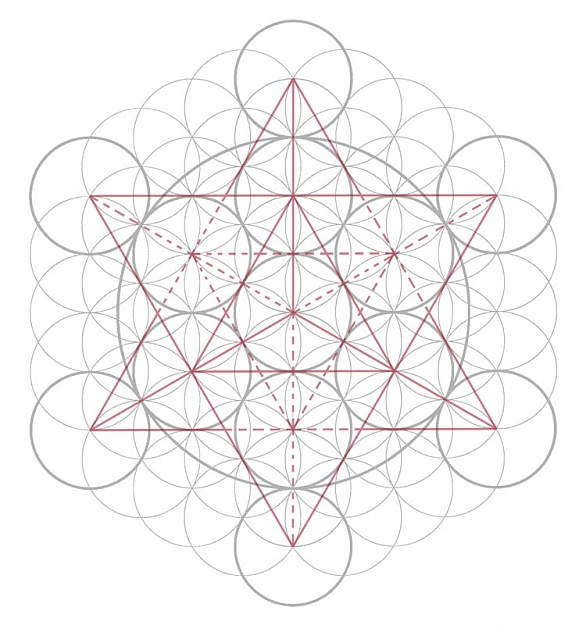
I think I found the same hypercube thingy you speak of. It is an incredible looking thing, and I have no doubt that if one were able to study it long enough and find some way of using it mathematically, it would be able to show patterns we have not yet perceived. (http://en.wikipedia.org/wiki/9-cube)

But alas poor Yorick... I am not Mandelbrot by a LONG stretch (in fact mathematically...
Mathematically i'm very weak too... and the Mandelbrot set is one of the most complex things that exist in mathematics... i hope that the way of trading that you will teach us "Peasants" is not so difficult....

Thank you for your interesting explanations
Sabrina
  • Post# 202
  • Quote
  • Dec 23, 2012 12:57pm
  • BlueMental
    Joined Nov 2009 | 186 Posts | Status: Don't Re- Member
Quoting Hansie
I've download the MBTrading - Desktop Pro what must we do with it?
Is it just to show us what the Pyrapoint look like and the channels it form?

I've includede some of the charts thats on the MB forum hope you don't mind If you do i'll delete them.
Cool, so now you have seen the Pyrapoint in action. The important part that the Pyrapoint tool does, which the GannGrid does not (unless you know about it) is that specific 'angles' (Gann Angles which are actually a ratio (in GannGrid it is called scale)) in Pyrapoint, they are actually angles, and they are all related to 360, halved and halved again.

In other words:-
360/2 = 180
180/2 = 90
90/2 = 45
45/2 =22.5
22.5 /2 = 11.25
and so on.

The other thing that Pyrapoint does is it sets the time width of the Grid. By using the Square Root of the price, and by checking which angle it is closest to then using the square of that number, gives you the WHEN that the time will be when it hits the next price.
To do this with GannGrid, you need to calculate it all and set your GannGrid accordingly.

I choose a different way of setting my GannGrid though. That (and Pyrapoint) is another story, for now, just check out whatever you can see from all you have. Do a Google search for "Pyrapoint Don Hall PDF" and read his book about Pyrapoint. It can be a bit confusing in some parts, but you will figure it out.
  • Post# 203
  • Quote
  • Dec 23, 2012 1:05pm | Edited at 1:17pm
  • BlueMental
    Joined Nov 2009 | 186 Posts | Status: Don't Re- Member
Quoting sabrys5769
Mathematically i'm very weak too... and the Mandelbrot set is one of the most complex things that exist in mathematics... i hope that the way of trading that you will teach us "Peasants" is not so difficult....

Thank you for your interesting explanations
Sabrina
Sabrina my dear, you have it all wrong, I might (if I am lucky and get upgraded enough) one day become a peasant. For now, I am not yet in that high a class range.

You as a woman have an advantage that men do not have. Even though 90% or more of all involved with trading are male (you know the old story), they (we men) lack the insight that women have. That female 'magic' that knows that this colour works well with that one and that = fashion. Where men (except for the gay community) have zero of that insight. To us, it is like explaining colour to a blind man.

I try my best to see how she moves and what her moods are, you have a clear advantage on the men. Use it!
  • Post# 204
  • Quote
  • Dec 23, 2012 2:20pm
  • sabrys5769 ● Online
    Joined Jun 2010 | 210 Posts | Status: Member
Quoting BlueMental
Sabrina my dear, you have it all wrong, I might (if I am lucky and get upgraded enough) one day become a peasant. For now, I am not yet in that high a class range.

You as a woman have an advantage that men do not have. Even though 90% or more of all involved with trading are male (you know the old story), they (we men) lack the insight that women have. That female 'magic' that knows that this colour works well with that one and that = fashion. Where men (except for the gay community) have zero of that insight. To us, it is like explaining colour...
BlueMental my friend, maybe you miss the inverted commas that i put when i wrote Peasants, the meaning is not what you understand ... i have a good friend that is a peasant, she lives in a beautiful place and does a beautiful work ... she is more lucky than me ...

It is wonderful that you think that there is something magic in female .. (Often when i try to explain to my husband That the color of his tie is orrible i really think to speak with a blind man ...) And that this can be useful in trading ..i always thought i would be much more logical in my trading approach, but maybe i was wrong...


Sabrina
  • Post# 205
  • Quote
  • Dec 23, 2012 5:22pm
  • BlackStack
    Joined Jan 2010 | 147 Posts | Status: Member
In 3D it probably has to do with a 3D star tetrahedron pattern
Attached Image (click to enlarge)
Click to Enlarge

Name: star tetrahedron.jpg
Size: 113 KB
  • Post# 206
  • Quote
  • Dec 26, 2012 12:25am
  • Kiads
    Joined May 2012 | 114 Posts | Status: "Trend" is your stubborn friend
Hi my dear Friend BlueMental..
Merry Christmas and Happy New Year..
sorry for my English it's not my native language

Thank You for your Beautiful BMI Long Indicator, she enriched my trading method.. but please forgive me that I make some modification so she can match with my method that actually base on EMA 72.. hopefully you don't mind about that..
As a day trader, I only use it in EU pair with H1 as direction finder and M15 as entry.. and it's work for me
I also love round number and it's quarter theory..
bellow I attach my BMI modification and template that I use, maybe you hv time to checked it out..
once again thanks to you and best regards
T Kiads
Attached Image (click to enlarge)
Click to Enlarge

Name: 72HLBB_BMI_Mod_EUH1.jpg
Size: 640 KB
Attached File
File Type: rar T_Kiads 72HLBB BMI Mod v01.rar   71 KB | 309 downloads
  • Post# 207
  • Quote
  • Dec 26, 2012 9:54am
  • BlueMental
    Joined Nov 2009 | 186 Posts | Status: Don't Re- Member
Quoting Kiads
Hi my dear Friend BlueMental..
Merry Christmas and Happy New Year..
sorry for my English it's not my native language

Thank You for your Beautiful BMI Long Indicator, she enriched my trading method.. but please forgive me that I make some modification...
...I also love round number and it's quarter theory...
T Kiads
Hi Kiads.
Merry Christmas to you too. Your English is great. I know I can not speak your language and you do well speaking (and writing mine).
You do not need to ask permission or forgiveness for changing the indicator. If it works for you, or if you can find a way to make it netter for everyone then please do.

Did you notice that the yellow (before you changed colour) is a better version of the OsMA indicator. Load up OsmA at the same settings as you have for BMI Long and check how many pips before OsMA it crosses over.

In this picture, BmiLong crosses 10 Bars before OsMA in front and 13 Bars before OsMA at the end. Take a look at the program of BMI Long (it is called 'lomg' because it is set for long time setting) This indicator is axtually the MacD Magic Monster, but the 'BothMac' EMA's are ALSO the MacD Magic Monster because they are the same. I use the EMA's because I do not have to check the trend each time.

Did you read the first 3 or 4 posts of this thread?
Attached Image
  • Post# 208
  • Quote
  • Dec 27, 2012 8:09am
  • Kiads
    Joined May 2012 | 114 Posts | Status: "Trend" is your stubborn friend
Quoting BlueMental
Hi Kiads.
Did you notice that the yellow (before you changed colour) is a better version of the OsMA indicator. Load up OsmA at the same settings as you have for BMI Long and check how many pips before OsMA it crosses over.

In this picture, BmiLong crosses 10 Bars before OsMA in front and 13 Bars before OsMA at the end. Take a look at the program of BMI Long (it is called 'lomg' because it is set for long time setting) This indicator is axtually the MacD Magic Monster, but the 'BothMac' EMA's are ALSO the MacD Magic Monster because they are...
Yes Sir, exactly.. .
of course if I put back your default setting it is still our beloved BMI Long. I just add BBonArray on her so i can 'see' more early according to my 72 HL Ema BB to find out correction wave like this picture bellow (between vertical yellow line) and I believe that 72 and 75 is not so difference in result..

Wish you all the best.
thank you
T_Kiads
Attached Image (click to enlarge)
Click to Enlarge

Name: BMI-72EMA HLBB EUH1 2012_12_27.jpg
Size: 677 KB
  • Post# 209
  • Quote
  • Dec 27, 2012 10:41am | Edited at 11:25am
  • BlueMental
    Joined Nov 2009 | 186 Posts | Status: Don't Re- Member
Hi Kiads,
The numbers are not too important, the way BMI Long is written is very similar to most MacD's, but there are some math 'twists' in there that give the zero lag. <edit> Actually it is not a zero lag MacD, it is the twists that give the more well defined zero lag 'OsMA, that is not an OsMA. </edit> The indicator will work fine no matter what settings you use, BUT the reason why I set her with those numbers, is because they follow a ratio of one number to the other. This can best be seen if you place the BMI_Long on the chart (Download BothMac). What that ration gives you is the price bounces off the EMA's (and no, the EMA's are not 75,365 and 60).

Not only does the price list bounce of the EMA's, but the EMA's bounce off the other EMA's, which gives you a better 'more clear' indication that 'yes this is a reversal, not a false one'.

If you know how to use it, it becomes an even more powerful indicator. If you set it to 12,26,9 it would work fine as well. My point is knowing which EMA's to set up to use WITH it. BMI_Long is only part of the all. The true power is more visible and easier to 'see' in BothMac.

Now this new indicator, Magic Moving Channels, used together with BothMac and Fib Circles is so precise as to WHEN to enter a trade, how many pips you can expect, and if it goes the wrong way, you know quickly and lose minimum pips.

So far, the only person who has shown and taken action towards learning how to see what I see is Hansie. He has looked in to pyrapoint and shows he is interested in looking deeper. Others are interested, but they have not (at least not visibly) started taking steps toward learning how to use the indicators.

Having these indicators is all good and well, but if you do not know how to use them to their very best, then they offer only a fraction of what the can show you.

Roosevelt was once asked, "If you have only 4 hours to chop down an oak tree, what will you do?", He replied, " I will spend the first three hours sharpening my axe."
  • Post# 210
  • Quote
  • Dec 27, 2012 11:16am
  • BlueMental
    Joined Nov 2009 | 186 Posts | Status: Don't Re- Member
Ok Peeps, here are the 'Updated' 3 Max Charts. And added are 3 Max Histo Charts. They should begin to make what Magic Moving Channels gives us,

This picture below is a zoomed out H1 GbpJpy. I placed the BMI_Long beneath it. Notice a resemblance between the two? But BMI_Long doesn't have the channels. BMI Long has (LOL) become redundant and is on his way to the glue factory. Notice I scaled the chart so you can see the top and bottom of Max. Look at the histo's that are overlaid above Max.


What do you see? What does this tell us, and what can you find useful in these indicators. Tell me your ideas and then I will tell you mine. Yes, I know you can not see anything clearly on the picture, download the indicators and place all 6 on one chart. Look at it. Zoom in, zoom out, EXPLORE them. Draw trend lines or circles or little furry monsters with machine guns if that makes you happy. Do whatever you can to extract any and all info out of them, then let me know what you can see that is usable in there for trading better.
Attached Files
File Type: mq4 MAX_chart.mq4   11 KB | 109 downloads
File Type: mq4 MAX_chart2.mq4   11 KB | 103 downloads
File Type: mq4 MAX_chart3.mq4   11 KB | 103 downloads
File Type: mq4 Max1_Histo.mq4   7 KB | 114 downloads
File Type: mq4 Max2_Histo.mq4   5 KB | 104 downloads
File Type: mq4 Max3_Histo.mq4   6 KB | 105 downloads
  • Post# 211
  • Quote
  • Dec 27, 2012 11:42am
  • BlueMental
    Joined Nov 2009 | 186 Posts | Status: Don't Re- Member
Quoting Kiads
Yes Sir, exactly.. .
of course if I put back your default setting it is still our beloved BMI Long. I just add BBonArray on her so i can 'see' more early according to my 72 HL Ema BB to find out correction wave like this picture bellow (between vertical yellow line) and I believe that 72 and 75 is not so difference in result..

Wish you all the best.
thank you
T_Kiads
So, correct me if I am wrong, you are using the BB in the BMI_Long sub-windows to show where the (now blue) 'OsMA' Line crosses the Bands. This looks useful, but I fear there is a problem if you are doing it that way. BMI_Long is scaled 'to fit', and so too is the Bands indicator. Depending on how zoomed in you are and what the numbers are of both BMI_Long and BB, you will find that as you scroll backwards and forwards, that the 'scale' changes, so too do the crossover points between BMI_Long and BB.

If you are seeing something else in another way that I am not seeing and you are NOT using it the way I stated, then please share your idea with us so we can understand it more.

Thanks.
  • Post# 212
  • Quote
  • Dec 27, 2012 6:17pm
  • selym_co
    Joined Aug 2011 | 475 Posts | Status: All the world is a stage...
Hi BlueMental ,

I tried to read as much as possible in ur thread which is really interesting , and it is sooo clear that you spent lots of effort about finding the details of the usage. All of these indicators , calculations , thoughts ...instead of keeping them for urself you just shared them here ... That's sooo respect-worth...

Although I do not like indicators on my charts , I downloaded them one by one and tried them on my chart , and the 75,365,60 adjustments are quite effective...

Thank you very much for sharing your ideas...Take care
  • Post# 213
  • Quote
  • Dec 28, 2012 3:53am
  • Kiads
    Joined May 2012 | 114 Posts | Status: "Trend" is your stubborn friend
Quoting BlueMental
So, correct me if I am wrong, you are using the BB in the BMI_Long sub-windows to show where the (now blue) 'OsMA' Line crosses the Bands. This looks useful, but I fear there is a problem if you are doing it that way. BMI_Long is scaled 'to fit', and so too is the Bands indicator. Depending on how zoomed in you are and what the numbers are of both BMI_Long and BB, you will find that as you scroll backwards and forwards, that the 'scale' changes, so too do the crossover points between BMI_Long and BB.

If you are seeing something else in another...
Hi again, actually I know about 'fit in' matter when I learn your BMI_Long script code and for me there's no problem at all because my main method still my 72 HL EMA on main chart. There are 3 options to play with BB on BMI, put BB at 'OsMA' line, or at 'MACD" line or both OsMA and MACD line that will give us 'Bands' of phantom line of median between OsMA and MACD line. I 'played' BB for several years so I working with this 'deviation' matter alot.

According to my template for EU H1-M15 the combination between 72 EMA HL BB in main chart and BMI_Long 'semi' oscillating in subwindow with BB put at 'OsMA' line will help me in 'trend-less/ranging' situation like the example picture bellow. (picture 1)

'You know' about 'squeeze and expand' matter at BB right ? so when BB on BMI became 'squeeze' and we know 'where is' the price in 72 EMA HLBB channel in main chart mostly we may 'know' the direction of the next 'expand' especially when price 'trapped' in the middle of 72 EMA HLBB channel (sideways)..

And.. by 'switching' BB from 'OsMA' to 'MACD' line we will 'see' further the 'almost sure thing' (I marked with circle at picture 2)..

I Hope I am not doing 'wrong' interpretation about this, I am still work it out like today (picture 3).

best regards
T_Kiads
Attached Images (click to enlarge)
Click to Enlarge

Name: 72EMA_HLBB_BMI_EUH1 trendless example.png
Size: 593 KB Click to Enlarge

Name: 72EMA_HLBB_BMI EUH1 trendless2.png
Size: 523 KB Click to Enlarge

Name: 72EMA HLBB_BMI_EUH1 2012_12_28_03_1031.png
Size: 463 KB
  • Post# 214
  • Quote
  • Dec 28, 2012 4:20am
  • Kiads
    Joined May 2012 | 114 Posts | Status: "Trend" is your stubborn friend
Another discussion about ' price direction angle' like in pyrapoint, i never trust MT4 'scale' ..LOL. this the worst charting package in relation with 'accuracy' maybe 'they' intended to do that.. hahahaha. I believe they could do better if they want to do it. but once you know how to play with 'angle' then you move one step further from 'predicting' to 'projecting'.
Even if you do the 'fixed' size one to one option in MT4, to make that fib arc 'look-like' perfect circle it is still make only 'price' axis to the real size but not the 'time' axis (the width of the standard candle), so 'what you see' is still depend on 'what your screen resolution' matter.
I do learn that 'geometrical charting' too and I prefer to use 'price base chart' instead of ' standard time base chart'..
hope it help..
  • Post# 215
  • Quote
  • Dec 28, 2012 4:52am
  • BlueMental
    Joined Nov 2009 | 186 Posts | Status: Don't Re- Member
Quoting Kiads
Hi again, actually I know about 'fit in'...
T_Kiads
OK, Sorry, I did not see when I looked the fiirst time that you had added the BB to BMI_Long. That means it does not deviate at all. I like your code, nice work.

Quoting Kiads
...so when BB on BMI became 'squeeze' and we know 'where is' the price in 72 EMA HLBB channel in main chart mostly we may 'know' the direction of the next 'expand' especially when price 'trapped' in the middle of 72 EMA HLBB channel (sideways)..

And.. by 'switching' BB from 'OsMA' to 'MACD' line we will 'see' further the 'almost sure thing' (I marked with circle at picture 2)...
T_Kiads
Yes this is great stuff. It is low risk high reward with high % chance of successful trade, 'almost sure thing' as you call it.

I am going to explore it more now that I put the template and indicators in.

One 'certain' trade that makes profit is better than 1000 'maybe' trades.


I like.
  • Post# 216
  • Quote
  • Dec 28, 2012 5:25am
  • BlueMental
    Joined Nov 2009 | 186 Posts | Status: Don't Re- Member
Quoting Kiads
Another discussion about ' price direction angle' like in pyrapoint, i never trust MT4 'scale' ..LOL. this the worst charting package in relation with 'accuracy' maybe 'they' intended to do that.. hahahaha. I believe they could do better if they want to do it. but once you know how to play with 'angle' then you move one step further from 'predicting' to 'projecting'.
Even if you do the 'fixed' size one to one option in MT4, to make that fib arc 'look-like' perfect circle it is still make only 'price' axis to the real size but not the 'time'...
LOL, talking about scale and Mt4 they limit the Grids, ellipses and Gann Lines to 2 decimal points. They might as well have used integers for accuracy. Not only that, the x-axis is in minutes for charts, but for coding it is in BarCount. The 'scale' changes depending on your timeframe. FibArcs remain constant if you change the scale. Ellipses use a totally different 'scale' ratio to FibArcs. If a FibArc is correct with scale set on 10, the ellipse has to be set to 0.1 to be the same. But to get FibArcs to line up the same on different timeframes, you need to use the minutes per bar as scale.

Yes, it is worse than a nightmare trying to use scale with Mt4.

take a look here:= http://www.forexfactory.com/showthre...40#post6325340

Where I was showing (with a live trade in progress) selym_co a trading strategy that usually ropes in the pips. I lost track of exactly what and where I was and used the wrong scale....

I give you two guesses what happened.

mt5 is even worse. They tried so hard to make mq5 into c++ that they missed the boat completely. To think (like windows API) you need a handle, and to do anything with mq5, you need a few hundred pages of code to do what you can with mq4 with 1 line. The system often drags if using mt5 and the memory seldom gets freed so you have to reboot every hour or 2 just to have a happy running OS.

None of this really matters, IF you know about it.

I actually want to get together with other coders to create a better trading platform. I find it ridiculous that the whole trading 'fraternity' can not use simple words like 'Close Position' instead they have to Buy a sell, and short to a selling position. If you have and open short position, you have to cover it. What is wrong with hit the 'close' button and it sends the correct signal (buy if sell open else sell if buy open).
The other thing that is the biggest problem of them all is the x-axis.

Simple solution, 1x = 1 minute and the visual (pixel x-axis) = 1x * bars per minute. So regardless of what the time frame is, squares remain squares and circles are circles.

When you try to tell (write a suggestion on Mq5 or Mq4 Forum) that their program is not perfect, they think you are the fool!

As far as the scale issue is concerned, I will write an 'indicator' that you move a line, put it at high or low, or wherever, and the indicator draws the FibArcs with the right setting for the the timeframe. I just haven't got around to it yet.

The 'circle' does not have to LOOK like a circle, it has to be a mathematically correct circle in relation to the chart data. Same with angles or Gann Angles (ratios).

The only thing that does NOT change from scale stretch or timeframe change, are the basic trend lines. But that is only true if you set them at first in M1. (The minutes get rounded off (as with everything else in Mq4) in the higher timeframes.)
  • Post# 217
  • Quote
  • Dec 28, 2012 5:53am
  • Kiads
    Joined May 2012 | 114 Posts | Status: "Trend" is your stubborn friend
Quoting BlueMental
OK, Sorry, I did not see when I looked the fiirst time that you had added the BB to BMI_Long. That means it does not deviate at all. I like your code, nice work.


Yes this is great stuff. It is low risk high reward with high % chance of successful trade, 'almost sure thing' as you call it.

I am going to explore it more now that I put the template and indicators in.

One 'certain' trade that makes profit is better than 1000 'maybe' trades.


I like.
Hi my friend BlueMental,
once again thank you, and I will continue explore this too..
regarding today example on EU. maybe you can checked it out at M15 TF for the detail. Use my template and 'switch the BB on BMI to 'MACD Line' (BBonSignal:false, BBon MACDline:true). Maybe you can 'see' early pattern of this stepped BB when it 'squeeze' in relating with 'OsMA' crossing zero line.
actually this is 'repeated' pattern for several times. In the picture bellow, when BB 'squeeze' (yellow box), and follow up by 'OsMA' cross zero line (in this case to negative territory ( pink box) , price will 'move' with big momentum, then it will 'rest' for a while (consolidating at aqua box) then will be continue until 'OsMA' create 'pattern' like inside the lime box (in subwindow) or price 'cross' my stepped lower band at main chart.
hope it help
Attached Image (click to enlarge)
Click to Enlarge

Name: 72EM HLBB_BMI_EUM15_2012_12_28_1241.png
Size: 402 KB
  • Post# 218
  • Quote
  • Dec 28, 2012 6:47am
  • Kiads
    Joined May 2012 | 114 Posts | Status: "Trend" is your stubborn friend
Thanks God, she work as expected.. LOL
Attached Image (click to enlarge)
Click to Enlarge

Name: 72EM HLBB_BMI_EUM15_2012_12_28_1344.png
Size: 409 KB
  • Post# 219
  • Quote
  • Dec 28, 2012 7:50am
  • Kiads
    Joined May 2012 | 114 Posts | Status: "Trend" is your stubborn friend
Switching 'side' to 'buyer' and already 'secured' my position
since after 'OsMA' cross up 'MACD' sooner or later 'OsMA' will cross or bounce at zero line (white box sub windows) and also price will 'met' EMA72 HL at main chart (also white box)..
hope it work
Attached Image (click to enlarge)
Click to Enlarge

Name: 72EM HLBB_BMI_EUM15_2012_12_28_1445.png
Size: 306 KB
  • Post# 220
  • Quote
  • Dec 28, 2012 8:42am
  • Kiads
    Joined May 2012 | 114 Posts | Status: "Trend" is your stubborn friend
Quoting Kiads
Switching 'side' to 'buyer' and already 'secured' my position
since after 'OsMA' cross up 'MACD' sooner or later 'OsMA' will cross or bounce at zero line (white box sub windows) and also price will 'met' EMA72 HL at main chart (also white box)..
hope it work
"Touch down"... eh or should I say 'touch up'... LOL..
Attached Image (click to enlarge)
Click to Enlarge

Name: 72EM HLBB_BMI_EUM15_2012_12_28_1539.png
Size: 386 KB
Thread Tools Search this Thread
Show Printable Version Show Printable Version
Email This Thread Email This Thread
Search this Thread:

Advanced Search

  • Trading Systems
  • /
  • BMI - MacD Magic Monster
  • Reply to Thread
    • 1 910Page 111213 16
1 trader viewing now
  • More

©2013 Forex Factory, Inc. / Terms of Use / Privacy Policy

Forex Factory® is a registered trademark.

Connect

  • Facebook
  • Twitter
  • RSS

Company

  • About FF
  • FF Blog
  • Careers at FF
  • Advertising
  • Contact FF

Products

  • Forums
  • Trades
  • Calendar
  • News
  • Market
  • Brokers
  • Trade Explorer

Website

  • Homepage
  • Search
  • User Guide
  • Member List
  • Online Now
  • Report a Bug