DislikedWeekend Exercise week 51:
Now for some back-testing exercise.
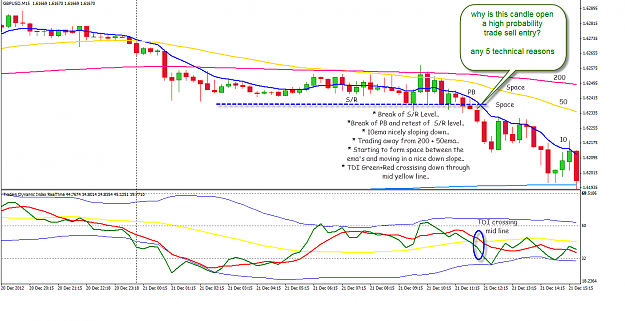
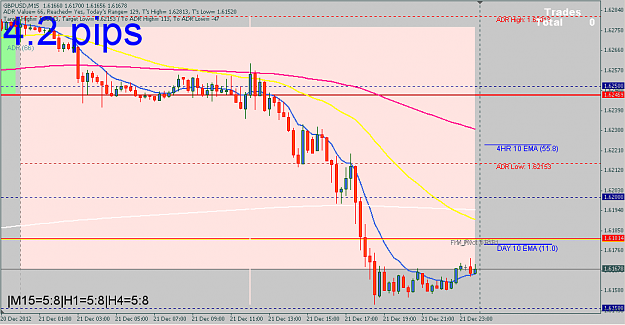
Look at the attached chart below. An example using GU.
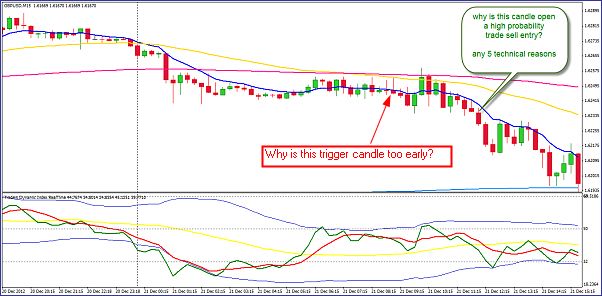
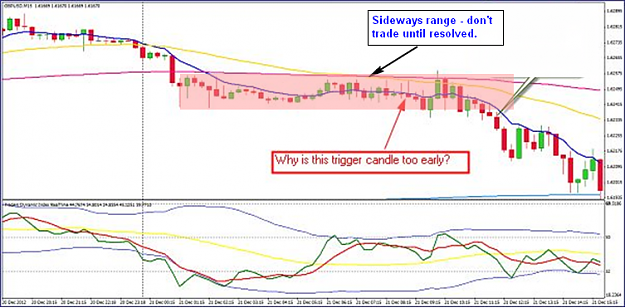
Can you think of 5 technical reasons why that candle is a high probability sell entry.
Post you answer to share with everyone here.Ignored
Attached Image (click to enlarge)