Hansie. (Also to everyone)
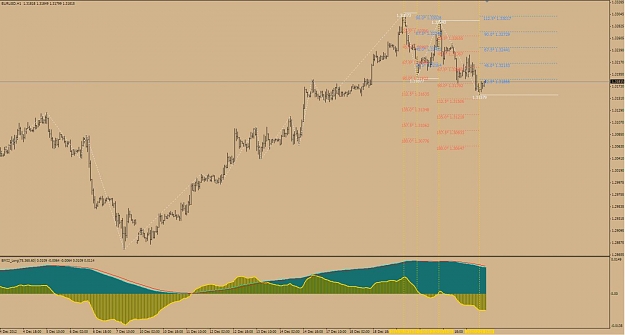
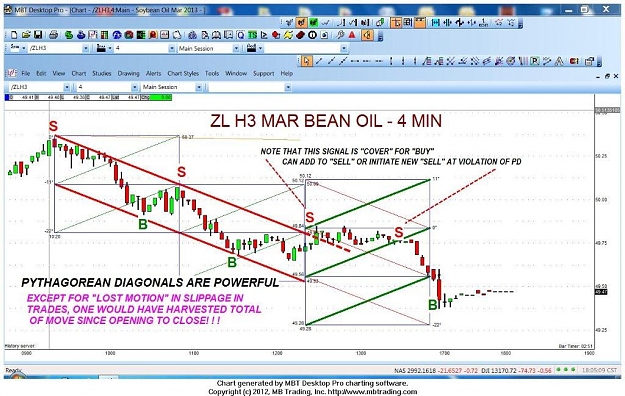
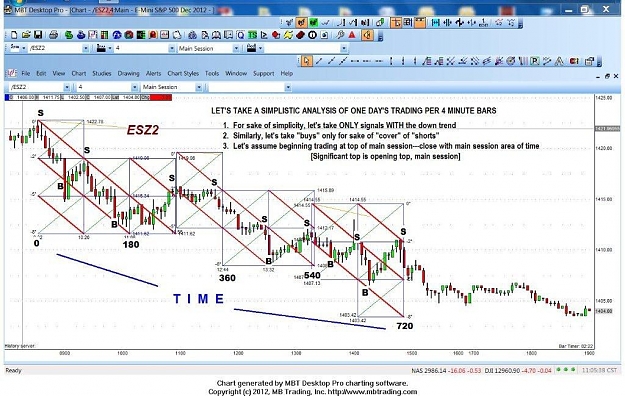
OK, I took a look at the pictures and the Pama Gann indicator (on the pics, I didn't download the indicator). To me, I see no useful way to use that indicator. I am not saying it is a bad indicator. If a person understands what the creator of the indicator knows and sees, then maybe it is useful.
If you were to go long at the start of the green stripes, and close when they end, you end up with some good and some bad trades, same with the red. If you trade using the thin yellow line (the price itself) and where it breaks through the Orange and red lines, you are in essence doing a limited Magic Monster type of style but there is not enough in just 2 ema's to see the full patern.
In short, this indicator (for me that is) is way too complicated. I only have an IQ of 7 so I can't understand the indicator.
Everything is based on patterns. Nature does not use a calculator. Nature also does not have a straight line. Everything is curves and moves in waves, just like a woman, or a cat. The way the price moves is just like a woman (or a cat) she can change direction for no reason that any man can understand or see, but to her it is simple and makes perfect sense. Just because men do not understand the reason, does not mean there is no reason. Men are simply blind to that reason.
If a man asks a woman why she is upset with him, then he sleeps on the couch because he asked! She can not understand how he can be so blind and NOT know.
Prices are exactly the same. If you look closely at any chart, you will see that there is a clear style, a way that she walks. Different pairs walk with different styles. UsdJpy is very different from GbpJpy. These women have different personalities. Grumpy Grandma (GbpJpy) is a bit of a schizophrenic. Sometimes she is smooth and sensual with a nice sway of her hips. Other times she is choppy and argumentative throwing Kung Fu moves up and down so fast it hits you sideways,
If you ever saw the movie with Al Pacino called "Scent Of A Woman," you will understand what I mean. It is not about 'calculating' when GrumpyGran will be changing direction, or how high or low the price will go. That is an accountant thing. A thing of numbers and maths. GG (GrumpyGran) doesn't work on numbers. She, just like any woman, works on the feel of things. The mood of things. It is by becoming familiar with her style, her energy that we can begin to understand her mood. At the same time we can not ever think "I know exactly what she will do next." She, just like any person, doesn't want to feel like their every move, thought and action is under investigation. Like they are spied on every minute of the day. The Judge and Jury can not ever be friends with those they judge. Those that are judged can not ever give freely of anything to those that judge them.
We need to get the idea of calculating and figuring her out so we can use her to our ends and means out of our minds. We enter into a relationship with the energy of the currency. If we try to be her master, in a sly way, she will be our master. If we are her friend and companion, she will be our friend and companion. By knowing her as a friend, we eventually begin to recognise her little wink or frown that tells us (her friends) that we should NOT think that she is going north (like everyone else at that time thinks) but she is actually going south.