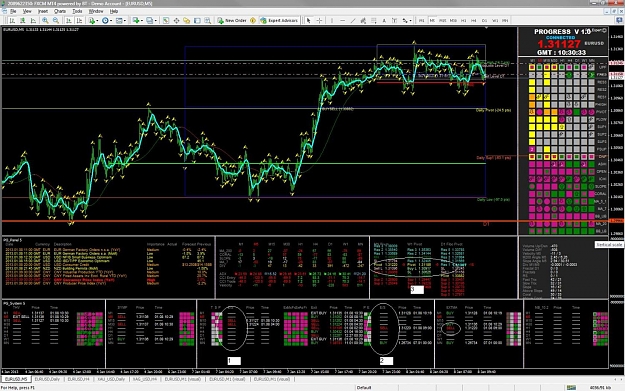
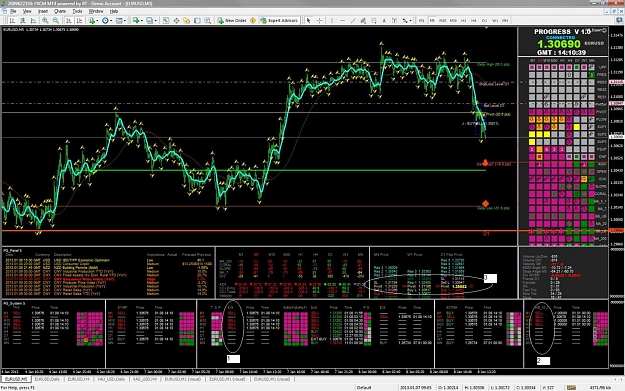
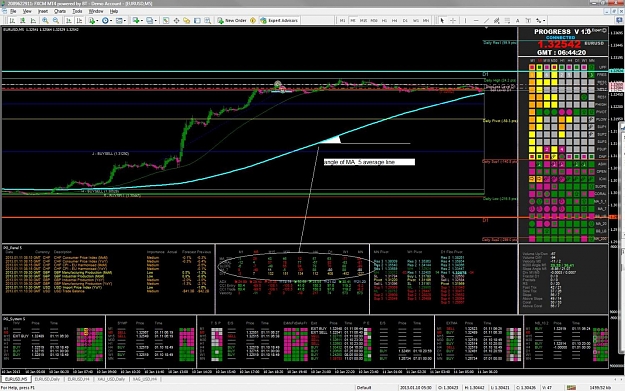
3-1 Progress Panel (Session modification)
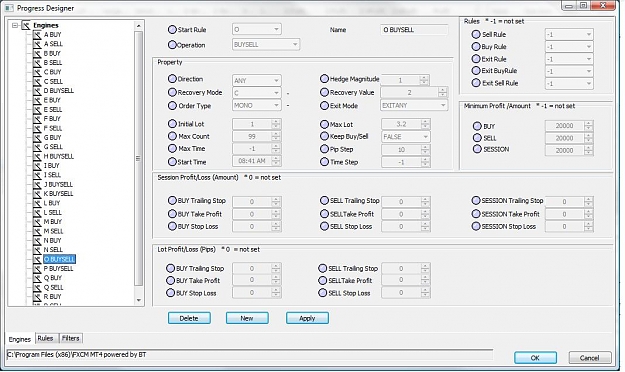
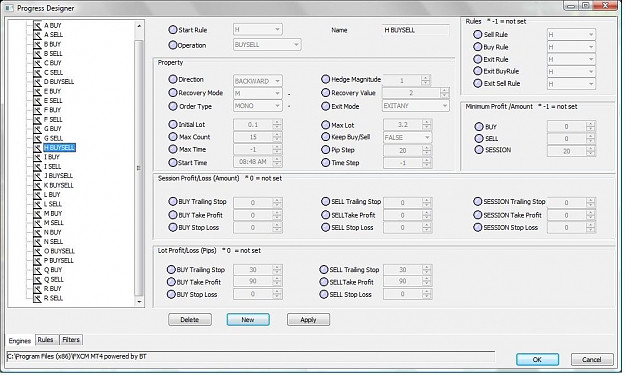
We can switch every property of our session from automatic to manual and vice/versa. When Property value is automatic, it means it is either set by the corresponding rule of the session or taken from the engine default values in your PG_Engines file. We can have a human intervention to every property of our session and change its value. When a value is switched to manual, the rule is not in charge of it anymore of it and the system will take the value set by you.
In our example below the pipstep field and the buy Trailing stop (Orange check) are shown.
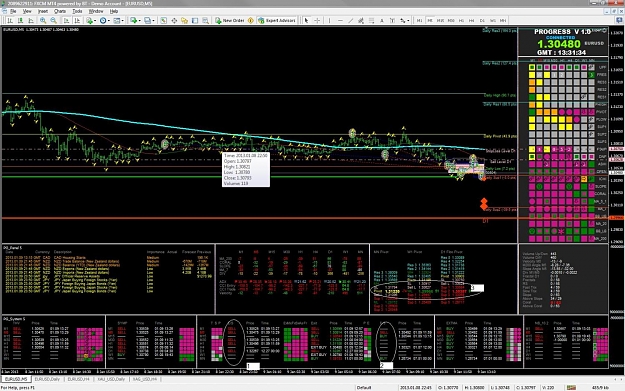
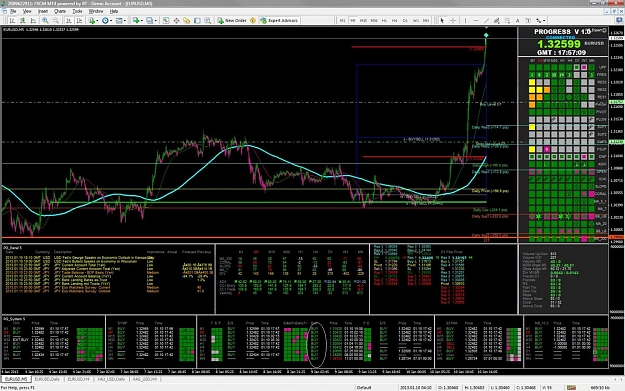
Attached Image (click to enlarge)