Forex Factory
  • Login

  • Username: Password:
  • 3:42am

  • Search
  • Home

  • Forums

  • Trades

  • Calendar

  • News

  • Market

  • Brokers

Options

Search
Search
Search

Subscribe to Thread

Bookmark Thread

First Page First Unread Last Page Last Post

Printable Version

Similar Threads

Trading with Point and Figure 128 replies

Point and Figure Trading 29 replies

Pros and Cons of Point & Figure Trading 10 replies

Trading with "Point And Figure" 34 replies

  • Trading Discussion
  • /
  • Reply to Thread
  • 159

Intraday Point and Figure Trading

  • Last Post
  • First Unread
  •  
  • 1 2021222324 Page 25
  •  
  • Post# 481
  • Quote
  • Nov 19, 2012 2:19am
  • fteller
    Joined Dec 2010 | 106 Posts | Status: Member
•The dollar index continues to remain firmly bullish on the daily chart, moving higher and breaking above the 81 region, as the currency of first reserve continues to strengthen following the U.S. election.
•This firm move higher for the U.S. dollar has been accompanied by sustained buying volume on both the daily and the three day chart, which have both provided additional momentum to the move higher, following the key breakout from the sideways congestion created during September and October, which saw the index trade in a narrow range.
•This platform of support is now providing the necessary springboard, and with the Hawkeye Heatmap now firmly green, the U.S. dollar looks set to continue higher in the short to medium term.
•Should the three day trend also transition through to bullish in due course, then we can expect to see the index climb to test the 83.00 region and beyond with consequent weakness across the major currency pairs, along with commodities. [Written by forexpros]


↓↓↓Click to learn more!↓↓↓
Inserted Code
https://docs.google.com/spreadsheet/pub?key=0AhxKzvQ2GlM8dDBqYWl6XzlEbFZDWFVob0FMbG9nbGc&output=html
See also
~~~> _https://docs.google.com/file/d/0B9cvIxidsTjvYnFHMWVmM25oVlk/preview
↑↑↑ OR ↓↓↓
~~~> _http://img822.imageshack.us/img822/5085/12nov18.pdf
A d d i t i o n a l l y

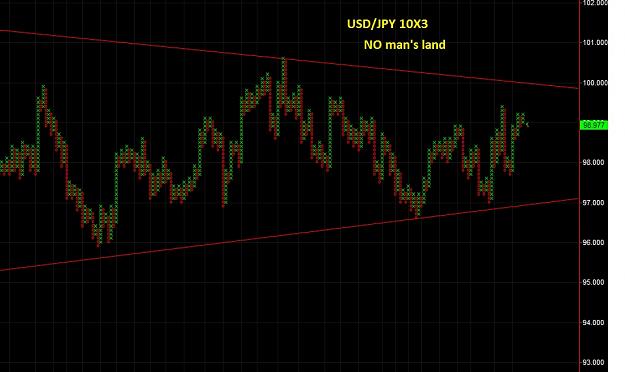
Point and Figure for Forex. Any pair.Charts.
  • Post# 482
  • Quote
  • Nov 26, 2012 6:24am
  • fteller
    Joined Dec 2010 | 106 Posts | Status: Member
Crude Oil Weekly Technical Outlook
•Sat Nov 24 12 09:51 ET Crude Oil Weekly Technical Outlook Nymex Crude Oil (CL)Crude oil edged higher to 89.98 last week but failed to take out 90 psychological level and retreated again.
•Nonetheless, note that firstly, it's has taken out near term falling channel.
•Secondly, it seems to be well supported by 4 hours 55 EMA.
•Thirdly, daily MACD is staying well above signal line.
•The development argues that fall from 100.42 might be completed at 84.05 already.
•Further rise will be mildly in favor as long as 86.17 minor support holds.
•Strong rally would be seen to 93.66 resistance to confirm the bullish case.
•Though, below 86.17 will flip bias back to the downside for another low below 84.05.
[Written by oilngold]

↓↓↓ Click to learn more! ↓↓↓
Inserted Code
https://docs.google.com/spreadsheet/pub?key=0AhxKzvQ2GlM8dDBqYWl6XzlEbFZDWFVob0FMbG9nbGc&output=html
  • Post# 483
  • Quote
  • Nov 26, 2012 6:31am
  • Blaiserboy
    Joined May 2005 | 498 Posts | Status: Member
Interesting re this chart, I was looking at it on StockCharts earlier this morning and wondering if it was about to start to move higher.
  • Post# 484
  • Quote
  • Nov 26, 2012 8:03am | Edited at 7:31pm
  • BillSuits
    Joined Aug 2010 | 63 Posts | Status: Something has gotta give....
Hi-

I use PnF charts to help with Forex trading as part of my strategy. You can go through the process of using indicators and the like on your platforms but I simply use the Index on Stockchart.com and plot them there. If you print it out you can just manually add in the Xs or Os during the off hours of the New York Martket. I had to do this as I am using ThinkorSwim and they lack any PnF plotting, though I have asked. But it is minimal work when you consider the amount that Stockcharts already does for you. The price differences between the Index and the forex product is not important for my analysis. The index is also in large amounts than the product; You just have to move the decimal over in your mind.

Here is an example of what I use frequently:

http://stockcharts.com/def/servlet/SC.pnf?chart=$XBP,PGUADANRBO[PA][D][F1!3!0.1!!2!20]&pref=G

GBP/USD: Use $XBP and a set the scaling method as USER DEFINED. That will allow you to change the interval. I use a box size of 0.1 which would correspond to 10 pips. You can't go smaller than 0.01 box size, btw.

For other Major currencies you can use the following Indexes:

EUR/USD: $XEU (or "FXE")
AUD/USD: $XAD
NZD/USD: $NZD
USD/CAD: $CAD

If you want to trade futures look there are more indexes for these.

I am not a fan of using these charts intraday (or PnFs intraday.)

Others may disagree.
  • Post# 485
  • Quote
  • Nov 27, 2012 1:53pm
  • Blaiserboy
    Joined May 2005 | 498 Posts | Status: Member
I prefer to use P&F on a daily basis although I have attempted, in the past, to use it on 60 minute charts...

My thinking now is that daily and 240 minute charts are the right ones for me to use because I seem to do better with those time frames.

You are quite right to adjust the parameters on StockCharts.com to get the look that you like IMO.
  • Post# 486
  • Quote
  • Dec 3, 2012 1:29am
  • metta87
    Joined Jul 2012 | 27 Posts | Status: Member
hello guyz,

how many columns of X AND O do you get on a daily basis ? I know pnf does not operate according to time but when I look at your charts there seem to be a lot of movement on them even when the boxes are more than 10.thanks
  • Post# 487
  • Quote
  • Dec 3, 2012 1:44am
  • Blaiserboy
    Joined May 2005 | 498 Posts | Status: Member
Quoting metta87
hello guyz,

how many columns of X AND O do you get on a daily basis ? I know pnf does not operate according to time but when I look at your charts there seem to be a lot of movement on them even when the boxes are more than 10.thanks
This question is hard to answer as you are not specifying which time frame you are asking about.
  • Post# 488
  • Quote
  • Dec 4, 2012 8:19am
  • Scooby66
    Joined Dec 2012 | 1 Post | Status: Junior Member
Hi Blaiserboy

I thought the whole point of PnF was there is no time frame. I have just started to look into websites that offer PnF and they all seem to require a time frame setting 5min hourly daily etc. And then the charts seem to look different. If a PnF chart is a 1 pip box size and 10 pip reversal I don't understand why they are asking me for a time setting? Could you explain please?
  • Post# 489
  • Quote
  • Dec 10, 2012 2:11am
  • fteller
    Joined Dec 2010 | 106 Posts | Status: Member
—The GBP/USD fell friday to trade at 1.6010 after the Bank of England yesterday held rates and policy.
—Today, industrial production and manufacturing production both disappointed markets reporting well below forecast, casting a greater doubt on the UK economy.
—Just a few days ago, the UK downgraded growth for 2013 and Chancellor Osborne, presented the Autumn statement with a negative forecast. [Written by forextv]

Click to learn more!~~~> _http://goo.gl/VAvNX
Attached File
File Type: pdf 12Dec09.pdf   79 KB | 49 downloads
  • Post# 490
  • Quote
  • Dec 17, 2012 3:11am
  • fteller
    Joined Dec 2010 | 106 Posts | Status: Member
—USDCHF Analysis - December 17, 2012
—USDCHF breaks below 0.9214 support, suggesting that the downtrend from 0.9971 has resumed.
—Further decline could be expected next week, and next target would be at 0.9000 area.
—Resistance levels are at 0.9300 and 0.9400, as long as these levels hold, the downtrend from 0.9511 will continue.
—For long term analysis, USDCHF had formed a cycle top at 0.9971 on weekly chart.
—Further decline to 0.8500 area would likely be seen over the next several months.[Written by ForexCycle]

Click to learn more!~~~> _http://goo.gl/FI6A0
||BJF Trading Group||Expert Advisor||MT Indicator||Forex Software||MQL4 Coding||
Attached File
File Type: pdf 12Dec17.pdf   81 KB | 43 downloads
  • Post# 491
  • Quote
  • Dec 22, 2012 10:30pm
  • metta87
    Joined Jul 2012 | 27 Posts | Status: Member
Hello all,

whats the difference of using pnf 10 ,3 on a 1 min chart or a daily ?
  • Post# 492
  • Quote
  • Dec 22, 2012 11:10pm
  • Blaiserboy
    Joined May 2005 | 498 Posts | Status: Member
Quoting metta87
Hello all,

whats the difference of using pnf 10 ,3 on a 1 min chart or a daily ?
The best way for you to understand the answer to that is to place the settings on a couple of charts and compare the results. Each chartist develops his own preferences as he gains experience.
  • Post# 493
  • Quote
  • Dec 24, 2012 11:06am
  • metta87
    Joined Jul 2012 | 27 Posts | Status: Member
Quoting Blaiserboy
The best way for you to understand the answer to that is to place the settings on a couple of charts and compare the results. Each chartist develops his own preferences as he gains experience.
Thanks Blaiserboy,

Actually that is what I did, Ive put a 10 box size 2 reversal on a one minute and on a daily chart, what happened is that on daily chart the boxes never reverse at the correct number (in this case 2) as they do on the one minute.In fact they go way past the mark so i was wondering if there was a limit to the size of the box according to the timeframe.Hope you understand better what i mean .
  • Post# 494
  • Quote
  • Dec 30, 2012 4:05am
  • fteller
    Joined Dec 2010 | 106 Posts | Status: Member
—USDJPY Analysis - December 29, 2012
—USDJPY's upward movement from 77.14 extends to as high as 86.63.
—Further rise could be expected after consolidation, and next target would be at 88.00 area.
—Support is at 85.50 followed by 84.50, as long as these levels hold, the uptrend will continue.
—For long term analysis, USDJPY had formed a cycle bottom at 77.14 on weekly chart.
—Further rise to 90.00 area is possible over the next several weeks. [ Written by ForexCycle]

Click to learn more!(PDF) ~~~> _http://goo.gl/YmhM6

||BJF Trading Group||Expert Advisor||MT Indicator||Forex Software||MQL4 Coding||
Attached File
File Type: pdf 12Dec29.pdf   90 KB | 54 downloads
  • Post# 495
  • Quote
  • Mar 15, 2013 10:05am
  • fteller
    Joined Dec 2010 | 106 Posts | Status: Member
The program is dead, I think so ...
Quote
This is a quick note to let you know we will no longer be selling
Bull's-Eye Broker 4.
(You previously downloaded Bull's-Eye Broker, the leader in Point and
Figure charting software.)

Today is your last chance to buy Bull's-Eye Broker 4 before we close the
door on this product forever. Details here:
_http://pointandfigure.com/purchase.php

Bull's-Eye Broker 5 has more features, and users love it. But we
understand that not all users want to pay more for these features.

That's why we're offering one last chance to purchase Bull's-Eye Broker 4.
It...
  • Post# 496
  • Quote
  • Last Post: Apr 4, 2013 12:09am | Edited at 12:34am
  • zoli
    Joined Apr 2009 | 440 Posts | Status: called zol actually
Hello guys. I loke the P&F charts!

I posted this to another thread but youmay be more interested. Here it is:

There are many ways of representation of Volume, Price and Time. I am looking to check a Tape Reading Chart in live. For the ones do not know what that is, here is an attachmet to study. Like I hinted above, its purpose is the same as all the nice indicators developed by you fellow traders. Yet, it does look different.

It looks like a P&F chart. It is a Break out chart, so one has to have a variable with a pre-determined (and adjustable) price range, which must be traded through in order to allow the indicator to plot an entry.
Instead of "X" or "O" there are however Volume figures plotted in numbers (in thousends or hundreds or whatever appropriate for the timeframe).

Also, different from the traditional construction of the P&F chart in that, it must plot zero values in case a gap happens. So there are either numbers or zero values.

As an additional difference, the next column starts only if the place above or bellow the current bar, where the new entry would come, is already filled.

So the time is not very vell registered here, only the price and the traded V at the set price levels. The representation of time would be a different color or indication for the Volume figure at every, say, 30 minutes or hour or whatever the user sees fit. (The figures are circled on the attachment.)

And we all own with thank and respect to Mr. Wyckoff for his chart by the way. This method is old but there is not so much new in the markest. Nothing new in human nature anyway.
Since the time of Mr. Wyckoff the markets grew and have become somewhat more hectic. Broader public, more funds, the f...ing high frequncy sh.t.
For example, the DJ has a far higher value since the 19-es, though the same number of companies construct it. Hmm, perhaps the USD inflated like crazy in the last times? Where does it end? Will we do the same in 100 years only with different figures? S&P will trade at some idiot 5000 points? So there is no more value whatever, only inflating money. Not a bad idea to pile up with gold, silver, land, or whatever real assets after all..... Even with water!

So is any skillful madam/gent interrested to code this? Could be a usefull addition to the set of tools.

Anyway, I wish you good trading all


Kind Regards

Zol

EDIT:
To follow up wit my previous post I would like to point out that the cute P&F is the best sort of figure chart I have seen on MT4 so far. It is very friendly and pleasing to the eye. It should be as we look the charts quite often…
One point I did notice, though, is that the 1 reversal entries do not look good. Better said, Wyckoff also did use 1 reversal figure charts but the standard construction of such a chart is so, that no 1 point entry happens. In doing so, one must add another entry to the same column.

Like this:
O
O X
O O
O
and not like this:


O
O X

O O
O


Anyway, just my point. Very useful tool non the less.
Attached File
File Type: pdf Specimen of Tape Reading Chart.pdf   46 KB | 50 downloads
Kind Regards zol
Thread Tools Search this Thread
Show Printable Version Show Printable Version
Email This Thread Email This Thread
Search this Thread:

Advanced Search

  • Trading Discussion
  • /
  • Intraday Point and Figure Trading
  • Reply to Thread
    • 1 2021222324 Page 25
0 traders viewing now

©2013 Forex Factory, Inc. / Terms of Use / Privacy Policy

Forex Factory® is a registered trademark.

Connect

  • Facebook
  • Twitter
  • RSS

Company

  • About FF
  • FF Blog
  • Careers at FF
  • Advertising
  • Contact FF

Products

  • Forums
  • Trades
  • Calendar
  • News
  • Market
  • Brokers
  • Trade Explorer

Website

  • Homepage
  • Search
  • User Guide
  • Member List
  • Online Now
  • Report a Bug