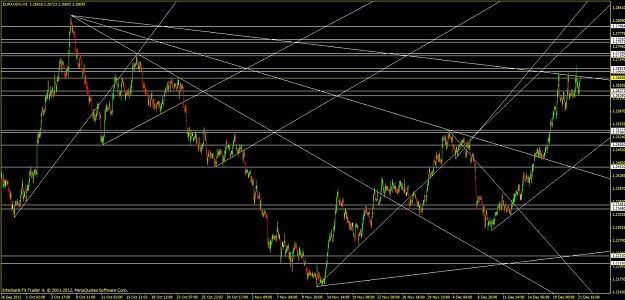
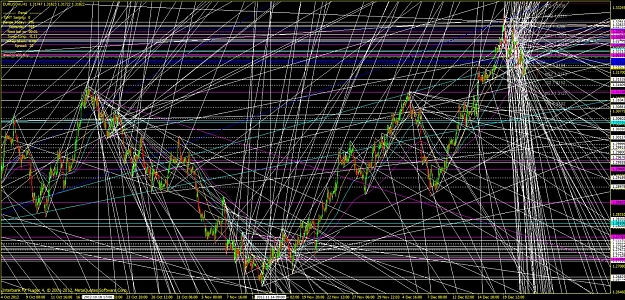
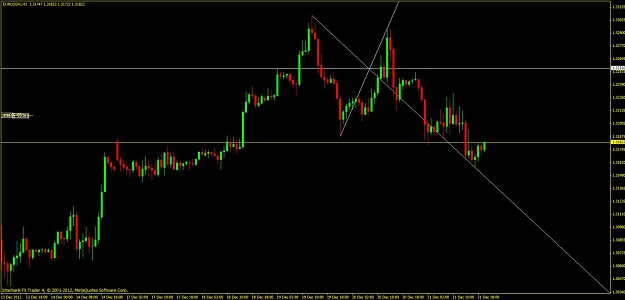
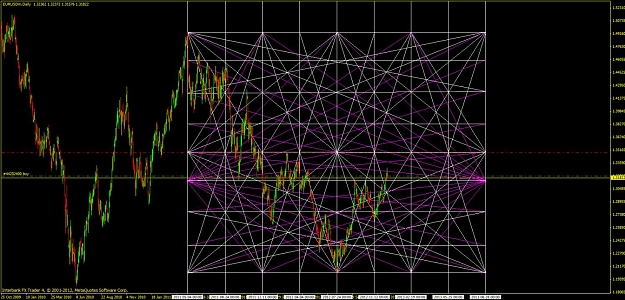
Forex Factory
  • Login

  • Username: Password:
  • 5:19am

  • Search
  • Home

  • Forums

  • Trades

  • Calendar

  • News

  • Market

  • Brokers

Options

Search
Search
Search

Subscribe to Thread

Bookmark Thread

First Page First Unread Last Page Last Post

Printable Version

Similar Threads

EA to draw Horizontal Lines 2 replies

SR Indicator not moving lines/labels correctly 2 replies

[POLL] How do you draw S&R and trend lines? 13 replies

how to draw mutiple trend lines with same slope 7 replies

How To Correctly Identify The Trend 4 replies

  • Trading Discussion
  • /
  • Reply to Thread
  • 41

How can I draw trend lines correctly?

  • Last Post
  • First Unread
  •  
  • 1 Page 234 5
  •  
  • Post# 21
  • Quote
  • Dec 21, 2012 4:42pm
  • ForExtraPips
    Joined Sep 2011 | 3,163 Posts | Status: Minor crosses. Major pips.
Quoting FXEnjoyment
Hi, With this DiNapoli AB=CD pattern you are at the beginning of your journey. Start to connect the swing lows from right to left with eachother, in order to draw the up trend. Connect the swing highs from right to left with eachother in a downtrend. For further information I would suggest you study the link here: http://www.forexpeacearmy.com/forex-...on-pro-banker/ Have a lot of fun!
I second that book. Great read.
"Observation is power. Judgement is weakness." -- Leland Val Vandewall
  • Post# 22
  • Quote
  • Dec 21, 2012 8:08pm
  • forexmnstr
    Joined Jul 2012 | 142 Posts | Status: “A Penny Saved is a Penny Earned”
Quoting gbengoyor
use Demark trendline indicator...u can google it

wow ... his strategys not only draws automatic trend lines, it also shows profit targets and exict levels ... but I dont know I dont believe in indicators ... I mean look at this chart below ... why cant you draw it yourself instead of letting the indicator to do the work ...
let the chart to be your chauffeur ... -Forexmnstr-
  • Post# 23
  • Quote
  • Dec 21, 2012 8:13pm
  • forexmnstr
    Joined Jul 2012 | 142 Posts | Status: “A Penny Saved is a Penny Earned”
Quoting wendigo
ask the dude who done this chart he seems to have a good handle on drawing lines

WENDIGO


why making your chart too complicated to understand the next move ... I mean what he was trying to figure out when drawing millions of trends on just few candles ... any way who are this dude ... is it usefull to draw many lines ... or just keep it simple?
let the chart to be your chauffeur ... -Forexmnstr-
  • Post# 24
  • Quote
  • Dec 21, 2012 8:15pm
  • forexmnstr
    Joined Jul 2012 | 142 Posts | Status: “A Penny Saved is a Penny Earned”
Quoting deltatrade
there is a trader who is a member and who seems to master trendlines. his user is wmd http://www.forexfactory.com/wmd.
how can i benefit from him ... did you ask him about his secret ... and how did you know that he is good
let the chart to be your chauffeur ... -Forexmnstr-
  • Post# 25
  • Quote
  • Dec 21, 2012 8:20pm
  • forexmnstr
    Joined Jul 2012 | 142 Posts | Status: “A Penny Saved is a Penny Earned”
Quoting Trader_V
Trendlines are like art. The beuaty lies in the eye of the beholder. They are subjective in nature but when you draw them according to your own rules you can make them more objective. Once you make them more objective you will have greater success with them. Like a couple of the other members here have mentioned Tom Demark is a good resource.
according to my own rule ... what do you mean ... what are yours ... I have tried my rule but it didnt work ... practicing without the knowledge is nothing
let the chart to be your chauffeur ... -Forexmnstr-
  • Post# 26
  • Quote
  • Dec 21, 2012 8:20pm
  • forexmnstr
    Joined Jul 2012 | 142 Posts | Status: “A Penny Saved is a Penny Earned”
Quoting pipcorn
I have nothing to do with the website:
http://www.forexhit.com/learn-forex/forex-trends.html

but it has an interesting approach about trends, take a look.
very usefull site thank you ...
let the chart to be your chauffeur ... -Forexmnstr-
  • Post# 27
  • Quote
  • Dec 21, 2012 8:29pm
  • ForExtraPips
    Joined Sep 2011 | 3,163 Posts | Status: Minor crosses. Major pips.
Quoting forexmnstr


why making your chart too complicated to understand the next move ... I mean what he was trying to figure out when drawing millions of trends on just few candles ... any way who are this dude ... is it usefull to draw many lines ... or just keep it simple?
You can either let your imagination run wild or go into trend line paralysis. Different strokes for different folks, I guess.
Attached Images (click to enlarge)
Click to Enlarge

Name: imagination.jpg
Size: 144 KB Click to Enlarge

Name: overkill.jpg
Size: 408 KB
"Observation is power. Judgement is weakness." -- Leland Val Vandewall
  • Post# 28
  • Quote
  • Dec 21, 2012 8:37pm
  • ForExtraPips
    Joined Sep 2011 | 3,163 Posts | Status: Minor crosses. Major pips.
Honestly, though. Whenever I get home from work, I'll just open up a H1 chart and connect the swing high with the swing low. Connecting tops and bottoms. And it makes a big old X. Then I put a horizontal line through the X, and if price is below the X at the time, then I'm expecting price to come up to that median line and stalling there, then trade accordingly once it deviates from there.
Attached Image (click to enlarge)
Click to Enlarge

Name: simple.jpg
Size: 73 KB
"Observation is power. Judgement is weakness." -- Leland Val Vandewall
  • Post# 29
  • Quote
  • Dec 21, 2012 9:23pm
  • forexmnstr
    Joined Jul 2012 | 142 Posts | Status: “A Penny Saved is a Penny Earned”
Quoting ForExtraPips
Honestly, though. Whenever I get home from work, I'll just open up a H1 chart and connect the swing high with the swing low. Connecting tops and bottoms. And it makes a big old X. Then I put a horizontal line through the X, and if price is below the X at the time, then I'm expecting price to come up to that median line and stalling there, then trade accordingly once it deviates from there.
Thank you very much ... i think this is the simplest and best way of drawing trends ... but still ... how can i make it more certain and much accurate ?
let the chart to be your chauffeur ... -Forexmnstr-
  • Post# 30
  • Quote
  • Dec 21, 2012 10:18pm
  • ForExtraPips
    Joined Sep 2011 | 3,163 Posts | Status: Minor crosses. Major pips.
Quoting forexmnstr
Thank you very much ... i think this is the simplest and best way of drawing trends ... but still ... how can i make it more certain and much accurate ?
Then that's where an open mind and much studying comes into play. But, trust me, the journey is worth it. Study up on Gann, the square of 9, 52, 144, etc..... When you square price, you get much better trend lines and results. Trend lines on angles, instead of just horizontal. GL
Attached Image (click to enlarge)
Click to Enlarge

Name: ganneu.jpg
Size: 190 KB
"Observation is power. Judgement is weakness." -- Leland Val Vandewall
  • Post# 31
  • Quote
  • Dec 22, 2012 8:03am
  • PoundTrader
    Joined Sep 2010 | 3,444 Posts | Status: Money Never Sleep
Quoting wendigo
ask the dude who done this chart he seems to have a good handle on drawing lines

WENDIGO
  • Post# 32
  • Quote
  • Dec 22, 2012 11:18am
  • forexmnstr
    Joined Jul 2012 | 142 Posts | Status: “A Penny Saved is a Penny Earned”


ok what i have learnt so far is that :
  1. The more times a price touche the trend line ... the more accurate it will be.
  2. only two points needed to draw a line ... but three or more to be called a real trend.
  3. a trend that are heading downward ... draw the line on the high of each price.
  4. when trend line break ... it doesnt mean that price will reverse just wait for the confirm which is .... ( I dont know yet ... the question is that how can I know that trend will break before it acctually breaks? ... this is the most important )
for example look at this chart and tell me were its heading next:


ok you will say down ... but it actually moved upward ... chart like this how to predict were its going using trends?
  1. trend lines are subjectives ... every one have his own ... but will it be same result? ... and which is the better way to make it accurate?
  2. the use of indicators like ... Exponential Moving Average ... Simple Moving Average ... etc
trendline maybe
1-uptrend : includes a positive slope connecting two or more low points .
2-downtrend : negative slope connecting two or more high points .
3-semilong scale & arithmatic : when there is a false breakout but trend still up or down trend .
4-valid trend : its valid untill a break ... which no one will know when but can be predicted ... but how ?


anyway in my experience I think trendlines will break when there is a release of an important news ... so we cant forget fundemantals when drawing trends am I right ...

ok now this chart below can any one tell me and analyse the trends and what they actually means when they are coming all from one start point:


Thanks in advance trendline traders
let the chart to be your chauffeur ... -Forexmnstr-
  • Post# 33
  • Quote
  • Dec 22, 2012 5:14pm
  • forexmnstr
    Joined Jul 2012 | 142 Posts | Status: “A Penny Saved is a Penny Earned”
Quoting FXEnjoyment
Hi, With this DiNapoli AB=CD pattern you are at the beginning of your journey. Start to connect the swing lows from right to left with eachother, in order to draw the up trend. Connect the swing highs from right to left with eachother in a downtrend. For further information I would suggest you study the link here: http://www.forexpeacearmy.com/forex-...on-pro-banker/ Have a lot of fun!
Thank you ... I found the forum that you mentioned interesting ...
let the chart to be your chauffeur ... -Forexmnstr-
  • Post# 34
  • Quote
  • Dec 22, 2012 5:43pm
  • forexmnstr
    Joined Jul 2012 | 142 Posts | Status: “A Penny Saved is a Penny Earned”
thanks alot robertk ... but how did you know if this trend on below chart is valid ... I think EUR/USD will break the trend and continue down ... making a new downtrend ... my view though ... but realy how come the trend below considered valid.. is it because of the third candle ... is it because it confirmed your trend ?


[/quote]
let the chart to be your chauffeur ... -Forexmnstr-
  • Post# 35
  • Quote
  • Dec 22, 2012 5:54pm
  • PIP Combine
    Joined Dec 2012 | 34 Posts | Status: Harvesting The Market For PIPs
[quote=forexmnstr;6318126]
ok now this chart below can any one tell me and analyse the trends and what they actually means when they are coming all from one start point:

Forexmnstr, below is your chart, which I marked up a bit to explain a few concept and further analysis.

This chart is a classic example of how price moves in an uptrend. It is stair stepping from one level to the next finding support, then breaking resistance, then old resistance becomes new support, then breaking resistance again and so on. You will notice I extended your lines and that is because trendlines are support / resistance and usually show a good relationships in the future. When these lines are extended, you see a nice relationship in this uptrend. Price finally breaks the first TL, then finds support and begins to create a new channel upward. In this new channel alot of times it will test or strike the back / underside of the broken trendline. You see this a number of times, until finally it consolidates and drops. It also is another good example of the old saying, "up on an escalator, down on an elevator". Price grinds up slowly with greed, but when fear takes over it is much stronger and price drops very quickly.

So, I am sure your question is what do I do with this chart? How do I trade it? There are a number of ways, which you will need to develop your own method, but there are some characteristics to observe.

1. Not a lot of great opportunities going with the trend on this example from TL's, but after the second or third touch is developed the trendline becomes good S/R and you can take long opportunities off of touches to the TL.
2. Once a TL has been broken, then support is found and it continues, the backside of the broken TL provides a great target for trend traders and can provide a short opportunity for counter trend traders. You see this many times on this chart and I circle some good ones in blue.
3. There are times on this chart where price just rides the TL. Usually it will ride along that line and hold, then make its way back into the channel. When it does this, best to just wait for a confirmation candle to see where it is going. I circle a few in blue and black to show this characteristic.

Hope that gives you some food for thought on TL's. Earlier in the thread, a trader mentioned a user WMD and he is excellent at trading TL's. You might check him out and the information he shares on teaching and mentoring on this subject.
Attached Image (click to enlarge)
Click to Enlarge

Name: Trendlines 1.jpg
Size: 134 KB
  • Post# 36
  • Quote
  • Dec 22, 2012 6:13pm
  • forexmnstr
    Joined Jul 2012 | 142 Posts | Status: “A Penny Saved is a Penny Earned”
[quote=PIP Combine;6318424]
Quoting forexmnstr
ok now this chart below can any one tell me and analyse the trends and what they actually means when they are coming all from one start point:

Forexmnstr, below is your chart, which I marked up a bit to explain a few concept and further analysis.

This chart is a classic example of how price moves in an uptrend. It is stair stepping from one level to the next finding support, then breaking resistance, then old resistance becomes new support, then breaking resistance again and so on. You will notice I extended your...
wow ... I did get a clear picture after your post ... great thank you all ... its been few days I posted this thread and Iam already getting how trends realy works ... but still I need to experience it on demo first because Iam not sure if iam ready to trade on my own trends ... iam actually trading using previous high and low on daily and hour charts using fib method and its been great ... but fib combined with a well drawn trend will make accuracy jump 5-6% thanks guys
let the chart to be your chauffeur ... -Forexmnstr-
  • Post# 37
  • Quote
  • Dec 22, 2012 6:27pm
  • Robertk ● Online
    Joined Jul 2011 | 788 Posts | Status: Member
Quoting forexmnstr
thanks alot robertk ... but how did you know if this trend on below chart is valid ... I think EUR/USD will break the trend and continue down ... making a new downtrend ... my view though ... but realy how come the trend below considered valid.. is it because of the third candle ... is it because it confirmed your trend ?


Btw, last post for today. Live example of the stuff I posted above. SP500 currently has a 0.75 (1h) and 0.66 (4h) positive correlation with EUR/USD.

1H chart of SP500 shows the following:


This would confirm that the drawn TL from the picture you quoted might actually be valid, and will result in further movement down for EUR/USD next week.
  • Post# 38
  • Quote
  • Dec 23, 2012 12:11am
  • Aich
    Joined Jan 2008 | 27 Posts | Status: Member
http://www.forexfactory.com/showthre...61#post2090761
Have a read of this thread before you start relying on trend lines too much.
In my view, they lag behind price so far that they are useless as indicators for an entry.
You've got the knowledge, now use it!!
  • Post# 39
  • Quote
  • Dec 23, 2012 4:46pm
  • pipcorn
    Joined Oct 2012 | 150 Posts | Status: Member
Quoting Harry Johnso
... In my view, they lag behind price so far that they are useless as indicators for an entry.
Excuse me sir, with all respect but you don´t know what you're saying.
Just ignore me. Thanks.
  • Post# 40
  • Quote
  • Dec 24, 2012 1:55am
  • Aich
    Joined Jan 2008 | 27 Posts | Status: Member
Quoting pipcorn
Excuse me sir, with all respect but you don´t know what you're saying.
Its interesting that you would make any comment at all without knowing how I trade, what I use to find entries, what time frame I operate under etc...
Trading is not about right or wrong, the sooner people realise this, the sooner you can get on with making some money.
This is the last you will hear from me on this thread.
My best wishes to all genuine traders.
You've got the knowledge, now use it!!
Thread Tools Search this Thread
Show Printable Version Show Printable Version
Email This Thread Email This Thread
Search this Thread:

Advanced Search

  • Trading Discussion
  • /
  • How can I draw trend lines correctly?
  • Reply to Thread
    • 1 Page 234 5
1 member viewing: sbzbena
  • More

©2013 Forex Factory, Inc. / Terms of Use / Privacy Policy

Forex Factory® is a registered trademark.

Connect

  • Facebook
  • Twitter
  • RSS

Company

  • About FF
  • FF Blog
  • Careers at FF
  • Advertising
  • Contact FF

Products

  • Forums
  • Trades
  • Calendar
  • News
  • Market
  • Brokers
  • Trade Explorer

Website

  • Homepage
  • Search
  • User Guide
  • Member List
  • Online Now
  • Report a Bug