Forex Factory
  • Login

  • Username: Password:
  • 10:09pm

  • Search
  • Home

  • Forums

  • Trades

  • Calendar

  • News

  • Market

  • Brokers

Options

Search
Search
Search

Subscribe to Thread

Bookmark Thread

First Page First Unread Last Page Last Post

Printable Version

Similar Threads

Naked Trading Principles 7 replies

The three market movements: 3 replies

  • Trading Systems
  • /
  • Reply to Thread
  • 91

Principles of market movements

  • Last Post
  • First Unread
  •  
  • 1 3334353637 Page 38
  •  
  • Post# 741
  • Quote
  • Dec 16, 2012 1:46pm
  • Dimitry
    Joined Aug 2010 | 12 Posts | Status: Member
Quoting allngap
Hello, thanks for sharing your trading insights with us. really appreciate it.

I have used the software but then i have a lot of questions regarding the price level relationship with volume.
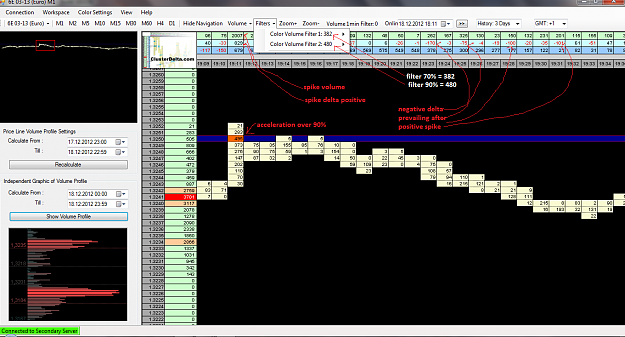
Those areas with high volume are the significant buy and sell areas.

my questions are
1. what is acceleration of volumes ? is it after the major volume (red/orange boxes) appear, the price will move for quite a distance ?
2. the data comes from futures market ?


thank you
1. No, the acceleration is a dV/dt, a sudden variation of V contracts in a short period of time. V contracts may have an average during the day, a sudden deviation from the statistical average marks an acceleration.

2. Yes it comes from CME Chicago (currencies, energy, S&P500), COMEX (metals) and ICE New York (dollar index).
  • Post# 742
  • Quote
  • Dec 16, 2012 7:50pm
  • allngap
    Joined May 2009 | 90 Posts | Status: Member
Quoting Dimitry
1. No, the acceleration is a dV/dt, a sudden variation of V contracts in a short period of time. V contracts may have an average during the day, a sudden deviation from the statistical average marks an acceleration.

2. Yes it comes from CME Chicago (currencies, energy, S&P500), COMEX (metals) and ICE New York (dollar index).
in your opinion, how accurate is the data ?? from my understanding not all of the transactions goes through CME.

got some more questions on this

Volume = Ask + Bid ??
Delta = Ask - Bid
can you determine the buy and sell(direction) from delta ? I have noticed at the certain turning point, the delta value becomes a few times higher than usual, the consecutive bars will be a strong move.
  • Post# 743
  • Quote
  • Dec 17, 2012 4:26am | Edited at 4:55am
  • Dimitry
    Joined Aug 2010 | 12 Posts | Status: Member
Quoting allngap
in your opinion, how accurate is the data ?? from my understanding not all of the transactions goes through CME.

got some more questions on this

Volume = Ask + Bid ??
Delta = Ask - Bid
can you determine the buy and sell(direction) from delta ? I have noticed at the certain turning point, the delta value becomes a few times higher than usual, the consecutive bars will be a strong move.

I have compared it with other software such as volfix, marketdelta, ninjatrader and they are the same data. The difference is that CD is a bit slower.

Yes, volume are ask+bid and delta is ask-bid.

I consider the acceleration at the point of control of the past days, (expecially if they are "naked"=they were never touched).

+the POC in real, of the act day, only after the 12 pm-13 pm (Chicago or New York time), when the American volumes stabilize.

At these points I apply the rules of graphic rebounds that are contained in this topic.

In addition the delta must make an inverse spike, in case of reverse short: large volume + large positive delta, and immediately after large negative delta.

The inversion long: large volume + large negative delta and immediately after large positive delta.

The volumetric spikes are the same of grafic pin bars, have the same meaning.

In correspondence of accelerations if these factors are lacking they are continuation patterns and not the reverse.
  • Post# 744
  • Quote
  • Dec 17, 2012 4:37am
  • TPOTrader
    Commercial Member | 494 Posts | Joined Oct 2012
Quoting Dimitry
The software Clusterdelta, that you see, is free, no payment, it displays the futures volumes from CME. Are available currencies, metals, energy and indexes.

If you like it, download from here and follow the numbering:

http://clusterdelta.com/platform#download
WOW. thanks man

i actually use futures data for my order flow analysis
NocturnalFX Auto-Trade Signal Service
TPOTrader All Time Return: 49.5%
  • Post# 745
  • Quote
  • Dec 17, 2012 7:43am
  • allngap
    Joined May 2009 | 90 Posts | Status: Member
Quoting Dimitry
I have compared it with other software such as volfix, marketdelta, ninjatrader and they are the same data. The difference is that CD is a bit slower.

Yes, volume are ask+bid and delta is ask-bid.

I consider the acceleration at the point of control of the past days, (expecially if they are "naked"=they were never touched).

+the POC in real, of the act day, only after the 12 pm-13 pm (Chicago or New York time), when the American volumes stabilize.

At these points I apply the rules of graphic rebounds that are contained in this topic.

In...

thanks again.

another question is the line which you decide to trade on. Is it the weekly most traded line with the highest volume ?? or can the same principles be applied on a smaller time frame ?? Lets say be traded on M15 timeframe.

there was once i spotted a trade on oil, the price spiked up to the highest volume line of the day and then reversed down for about $2. wow that was really unbelievable that it reversed on that level.
  • Post# 746
  • Quote
  • Dec 17, 2012 9:02am
  • allngap
    Joined May 2009 | 90 Posts | Status: Member
another question is why the data from futures are sometimes different from spot price ??
the data from CD sometimes is higher than what i see at spot.
  • Post# 747
  • Quote
  • Dec 17, 2012 9:21am | Edited at 10:10am – table does not show well
  • Dimitry
    Joined Aug 2010 | 12 Posts | Status: Member
Quoting allngap
thanks again.

another question is the line which you decide to trade on. Is it the weekly most traded line with the highest volume ?? or can the same principles be applied on a smaller time frame ?? Lets say be traded on M15 timeframe.

there was once i spotted a trade on oil, the price spiked up to the highest volume line of the day and then reversed down for about $2. wow that was really unbelievable that it reversed on that level.
It can be applied on each TF, change the target profit.

I personally use only daily POC, do not use contract, month, weeks or intraday POC.

I see the daily POC, quickly, every morning, from this site (apart Clusterdelta):

http://fxcoder.ru/services/futures-volumes

or:

http://trading-evolution.com/forum/portal.php


Then the acceleration is always on 1m on Clusterdelta.

The accelerations form a normal distribution which is with mean and standard deviation.

For example I show you all the distribution for the euro/usd:

European session: From 2am to 8:30am (New York Time):


American session, from 8:31am to 17pm (New York time):

I usually imposed two filters: one at 70% and the second at 90%, then they are 382 contracts and 480 contracts in the american session.

On days with high volatile and news I can put them even more stringent, for example 85% and 95%.
  • Post# 748
  • Quote
  • Dec 17, 2012 9:35am | Edited at 10:04am
  • Dimitry
    Joined Aug 2010 | 12 Posts | Status: Member
The table does not show well, it is a normal distribution: probability in % and number of contracts.

100% = 1757
97.5% = 569
95% = 528
92.5% = 501
90% = 480
etc.
  • Post# 749
  • Quote
  • Dec 17, 2012 9:52am
  • Dimitry
    Joined Aug 2010 | 12 Posts | Status: Member
Quoting allngap
another question is why the data from futures are sometimes different from spot price ??
the data from CD sometimes is higher than what i see at spot.

Yes, it is normal, at the beginning of each contract (March, June, September and December) there is a difference between futures and spot that gradually decreases towards the end of each futures contract.
  • Post# 750
  • Quote
  • Dec 17, 2012 10:57am
  • Dimitry
    Joined Aug 2010 | 12 Posts | Status: Member
Another useful means in addition, the differences (divergences) between the price (above) and the cumulative delta (below)
Attached Image (click to enlarge)
Click to Enlarge

Name: diver.png
Size: 189 KB
  • Post# 751
  • Quote
  • Dec 17, 2012 10:46pm
  • allngap
    Joined May 2009 | 90 Posts | Status: Member
Quoting Dimitry
It can be applied on each TF, change the target profit.

I personally use only daily POC, do not use contract, month, weeks or intraday POC.

I see the daily POC, quickly, every morning, from this site (apart Clusterdelta):

http://fxcoder.ru/services/futures-volumes

or:

http://trading-evolution.com/forum/portal.php


Then the acceleration is always on 1m on Clusterdelta.

The accelerations form a normal distribution which is with mean and standard deviation.

For example I show you all the distribution...
could you show on the charts ? i cannot imagine how these calculations come about. Thank you.

acceleration of volume on M1 charts ? means all of the big volumes are not separated over a price level but always can be seen at M1 ?
  • Post# 752
  • Quote
  • Dec 18, 2012 2:26am
  • wendigo
    Joined Nov 2012 | 119 Posts | Status: stop learning and start thinking
Quoting Dimitry
The software Clusterdelta, that you see, is free, no payment, it displays the futures volumes from CME. Are available currencies, metals, energy and indexes.

If you like it, download from here and follow the numbering:

http://clusterdelta.com/platform#download
clusterdelta is marketdelta except marketdelta charge for the service just go to clusterdelta.com translate from russian to you own language and download it thats all i did saves paying a monthly subscription for the exact same thing

WENDIGO
  • Post# 753
  • Quote
  • Dec 18, 2012 4:53pm
  • Dimitry
    Joined Aug 2010 | 12 Posts | Status: Member
Quoting allngap
could you show on the charts ? i cannot imagine how these calculations come about. Thank you.

acceleration of volume on M1 charts ? means all of the big volumes are not separated over a price level but always can be seen at M1 ?
The distribution was calculated by recording all accelerations 1m for 6 months, then I made a statistical study with mean, standard deviation etc.

Yes, the acceleration can be studied only at low time frame, it would be better in terms of seconds if possible.

Perhaps you are referring to POC, but it is a different concept.

In figure where I place the two filters 70% and 90%, with an example of a set up short.
Attached Image (click to enlarge)
Click to Enlarge

Name: euro.png
Size: 107 KB
  • Post# 754
  • Quote
  • Dec 20, 2012 6:14am
  • allngap
    Joined May 2009 | 90 Posts | Status: Member
Quoting Dimitry
The distribution was calculated by recording all accelerations 1m for 6 months, then I made a statistical study with mean, standard deviation etc.

Yes, the acceleration can be studied only at low time frame, it would be better in terms of seconds if possible.

Perhaps you are referring to POC, but it is a different concept.

In figure where I place the two filters 70% and 90%, with an example of a set up short.
thanks for showing me so many information. I'll get back to you if i got more questions. Have a happy holidays and a good trading year for 2013 !
  • Post# 755
  • Quote
  • Dec 21, 2012 6:29am
  • Dimitry
    Joined Aug 2010 | 12 Posts | Status: Member
Quoting allngap
thanks for showing me so many information. I'll get back to you if i got more questions. Have a happy holidays and a good trading year for 2013 !

OK, happy holidays.
  • Post# 756
  • Quote
  • Last Post: Feb 1, 2013 7:19am
  • allngap
    Joined May 2009 | 90 Posts | Status: Member
Hi Dimitri,

i have another question for you. i've been testing by using values of delta for smaller timeframe but not very effective. However i will not give up and will devise a way to counter the market noise.

I do use another indicator on MT4 which is cumulative delta indicator. it detects the number of delta much like the number on the top of ClusterDelta software number and plots it in a line.

What i want to ask is have you noticed a pattern where when the cumulative delta becomes from very negative turning into positive, the price will soon revert from a downtrend to uptrend on daily chart ? recently GU has been downtrend and trending down about 500pips. On last friday, the cumulative delta starts to go up (less positive), yet the price still goes down about 140pips.

after that a strong reversal is seen (about 250pips) till now. Is it smart money is buying as the trend moves down ?
Thread Tools Search this Thread
Show Printable Version Show Printable Version
Email This Thread Email This Thread
Search this Thread:

Advanced Search

  • Trading Systems
  • /
  • Principles of market movements
  • Reply to Thread
    • 1 3334353637 Page 38
0 traders viewing now

©2013 Forex Factory, Inc. / Terms of Use / Privacy Policy

Forex Factory® is a registered trademark.

Connect

  • Facebook
  • Twitter
  • RSS

Company

  • About FF
  • FF Blog
  • Careers at FF
  • Advertising
  • Contact FF

Products

  • Forums
  • Trades
  • Calendar
  • News
  • Market
  • Brokers
  • Trade Explorer

Website

  • Homepage
  • Search
  • User Guide
  • Member List
  • Online Now
  • Report a Bug