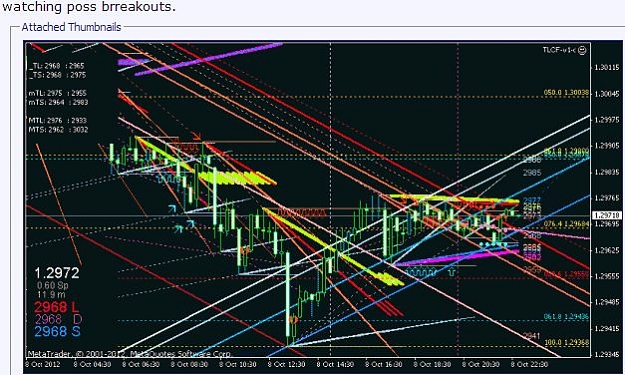
let the chart to be your chauffeur ... -Forexmnstr-
- | Joined Jul 2012 | Status: *Time is my only friend* | 152 Posts
let the chart to be your chauffeur ... -Forexmnstr-
- | Joined Jul 2012 | Status: *Time is my only friend* | 152 Posts
let the chart to be your chauffeur ... -Forexmnstr-

- | Joined Dec 2012 | Status: Junior Member | 6 Posts
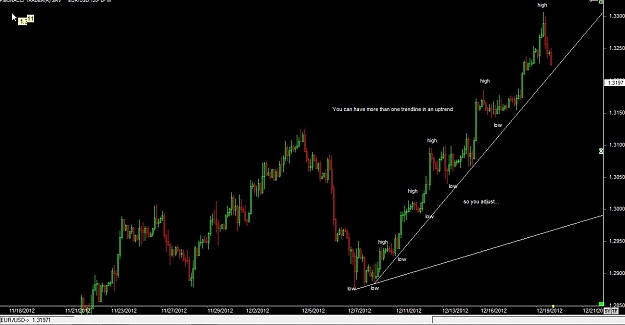
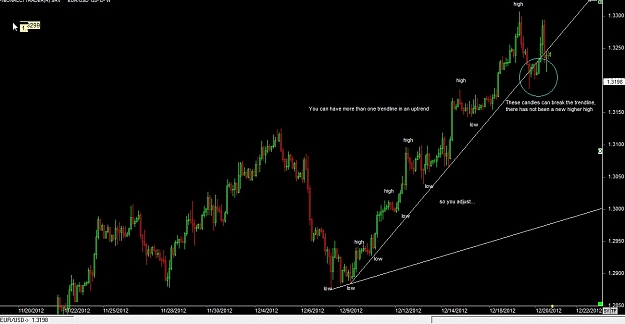
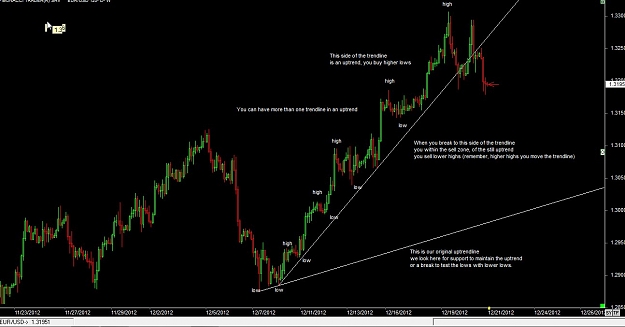
it all comes back to planning your trade and trading your plan