- Even if it did not work, you'd still learn so much of an huge knowledge about how the markets internals work that you'd be much more profitable in whatever other method you'd choose.
- The question is not really going to help you. Why? Because every statistically profitable trading system could work for everybody except you.
There's no hard rule about what works and what does not, else everybody would have jumped on the proven working methods years ago.
Sadly, everybody HAS to find a method he's most comfortable with and customize it for himself. Those going for premade deals are bound to be burned and also disappointed.
Finally, the most important factor in profitability is ... you. You and your psyche are the ultimate obstacle on your road to success, the more you'll trade the more you'll discover what I just wrote is true. There's no easy way out of this, no magic method or trading system that will keep you from smashing your face against your own behaviors, psychology, attitude towards risk and the markets.
fxgroup, how to handle Christmas and New Year with this method? When do we stop trading and when do we start again?
Ignored
Hi Iulian...my Christmas would be handled with my family, meanwhile the New Year by ski....just joking !
As I concern the trading is an important part of our lives, but are far more important those aspects of life as family,friends, hobbies, etc. We shouldn't let the trading to overwhelm us ..we are human beings and in this wonderful period of the year we really have to spend some time with the people we love !
P.S. The PA beauty is it really works in every circumstances...only the MM is different !
fxgroup, how to handle Christmas and New Year with this method? When do we stop trading and when do we start again?
Ignored
If I may add something to FXGroup's reply: as you most probably know, markets are thin during Christmas, the volatility may make money management harder but not just that. Depending on the country you live in, your government may require a lot of additional taxes paperwork in case your trades are kept open throughout the end of the year. In some countries, if your trade stays open through Dec 31 you might risk additional taxes affected by your P&L and even to pay something due to your outstanding notional (that is the turnover / broker bond you get by leasing leveraged capital).
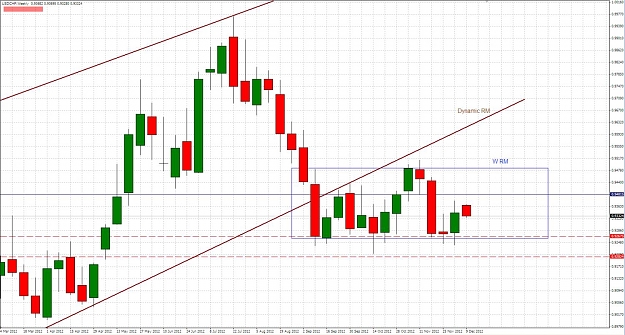
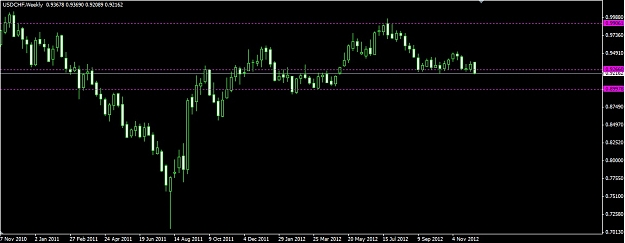
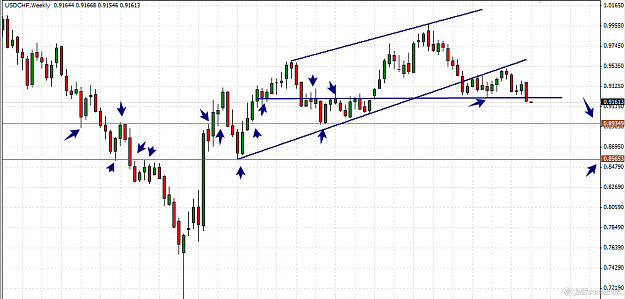
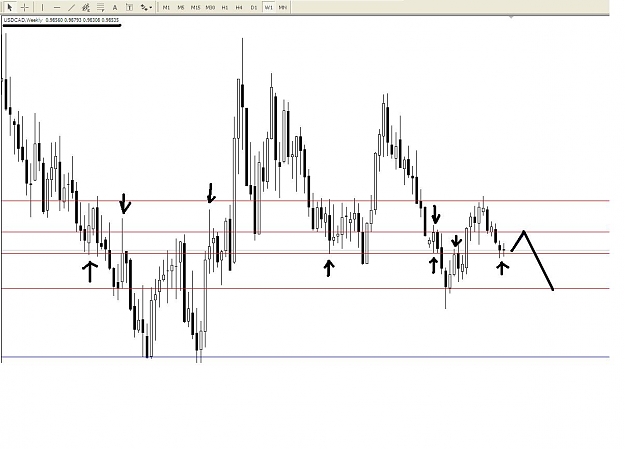
Hi FxGroup, am newbie here, I appreciate your effort in sharing and teaching. Hope you can advice on a setup I come across in USDCHF. In the weekly charts, if P close below 0.9266, I am thinking of going short. What do you think?
Hi FxGroup, am newbie here, I appreciate your effort in sharing and teaching. Hope you can advice on a setup I come across in USDCHF. In the weekly charts, if P close below 0.9266, I am thinking of going short. What do you think?
Ignored
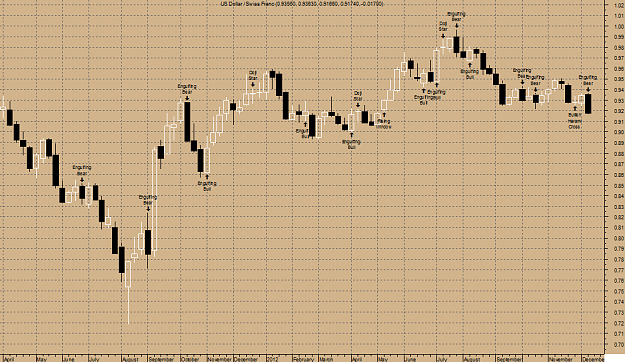
A Weekly big black candle has formed. This is a bearish candle as prices closed significantly lower than they opened. If the candle appears when prices are "high," it may be the first sign of a top. If it occurs when prices are confronting an overhead resistance area (e.g., a moving average, trend line, or price resistance level), the long black candle adds credibility to the resistance. Similarly, if the candle appears as prices break below a support area, the long black candle confirms the failure of the support area.
For the past 10 Weekly candlestick bars as of 14/12/12, there are 5 white candles versus 4 black candles with a net of 1 white candles.
For the past 50 Weekly candlestick bars as of 14/12/12, there are 23 white candles versus 26 black candles with a net of 3 black candles.
A Weekly engulfing bearish line has formed (where a black candle's real body completely contains the previous white candle's real body). The engulfing bearish pattern is bearish during an uptrend. It signifies that the momentum may be shifting from the bulls to the bears.
If the engulfing bearish pattern occurs during a downtrend (which appears to be the case with US Dollar / Swiss Franc), it may be a last engulfing bottom which indicates a bullish reversal. The test to see if this is the case is if the next candle closes above the bottom the current (black) candle's real body.
Hi, thanks for the reply. Isn't the support at 0.9266 an important support line? If P closes down below 0.9266, that gives a signal that the trend is bearish, no ?
|
Commercial Member
|
Joined Nov 2010
|1,178 Posts
[quote=Ezekiel Chew;6296957]
Quote
Disliked
A Weekly big black candle has formed. This is a bearish candle as prices closed significantly lower than they opened. If the candle appears when prices are "high," it may be the first sign of a top. If it occurs when prices are confronting an overhead resistance area (e.g., a moving average, trend line, or price resistance level), the long black candle adds credibility to the resistance. Similarly, if the candle appears as prices break below a support area, the long black candle confirms the failure of the support area.
For the past 10...
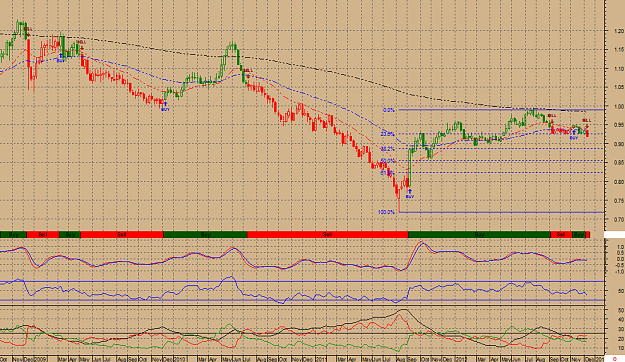
The trading IS far simplier than all your indicators !...You have so many, that I really can't see the P !
|
Joined Aug 2010
|
Status: Roaring in a cave near you
|237 Posts
FXGroup could be in vacation or go any time now.
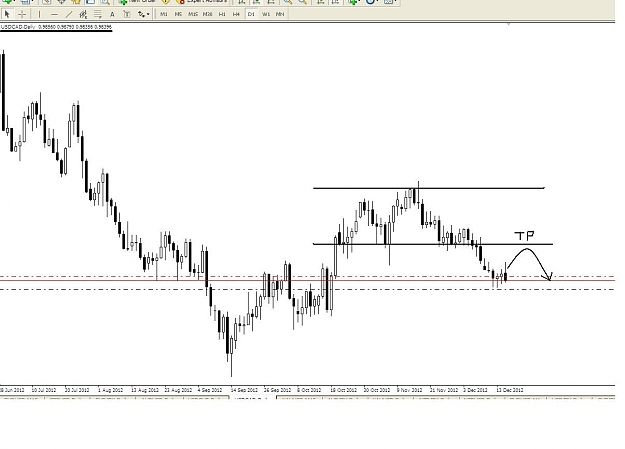
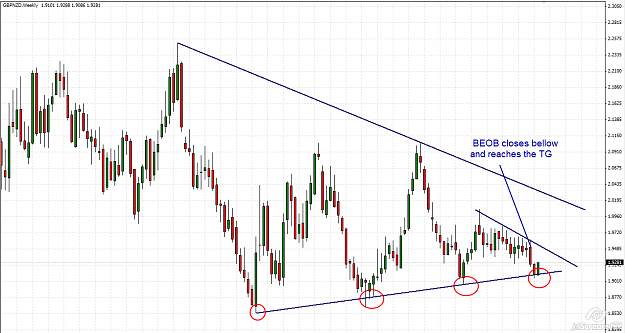
As for your chart, to me it looks like a triangle that broke in bearish direction and is retracing up to its lower trend line. If bearish price action happens you are meant to seek for short trades, not long. If long price action happens you enter a particular case called market extension and unless you really know what you are doing, you should not trade it.
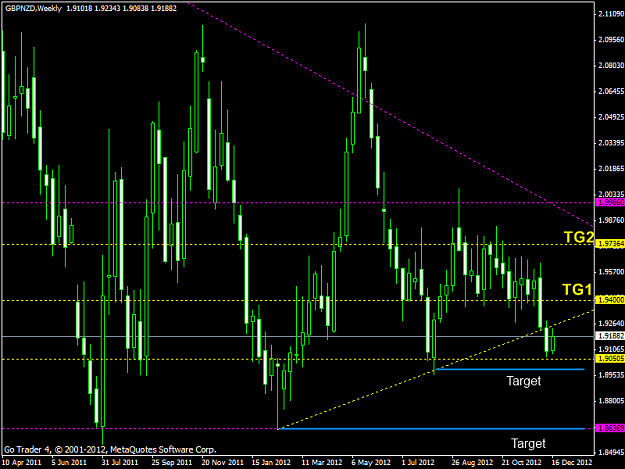
Hi dfumagalli, thanks for the reply. Well, my reasoning for saying long in GBPNZD is because the support line at 1.9050 is more, how shall i put it, prominent/strong than the trend line. Correct me if I am wrong in this analysis, m still a newbie in trading.
Hi dfumagalli, thanks for the reply. Well, my reasoning for saying long in GBPNZD is because the support line at 1.9050 is more, how shall i put it, prominent/strong than the trend line. Correct me if I am wrong in this analysis, m still a newbie in trading.
Ignored
The correct way is: "what price is doing (WPD)?".
If you understand it then you have to find "where price is going (WPG)"?
If you have *any* doubt about WPD you are way, way better skipping the trade completely.
Rule #1: capital preservation, and you can't fulfill it if you are not confident you have understood what the market is saying.
So, given the classic and FXGroup teachings say about triangles, WPD for me is: "price formed a triangle and broke it downwards. I expect price to retrace up to the triangle trend line to confirm the triangle itself, then price should fall".
Now, it's perfectly possible that price won't "obey" to any of that, WE traders are meant to bend to price's whims.
But here's the "contract", the "deal":
"Dear Mr. Price, if you do the triangle thing then I'll trust you with my money in a short trade after the daily time frame confirms the triangle with a retracement".
If Mr. Price won't do what I planned, then it means I did not "get" what price is doing and thus I shall NOT trade it. Else the risk of a loss is just brutal.
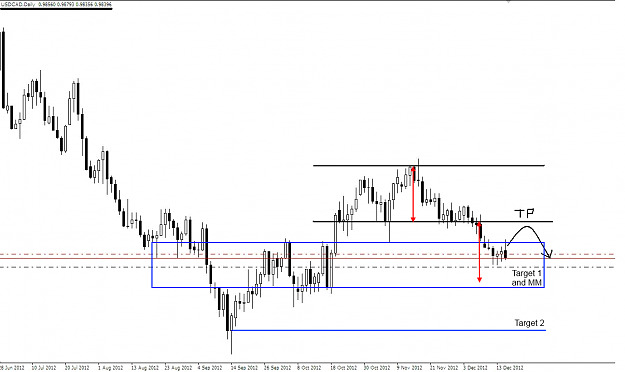
In case price will do as I planned, then it should also tell me WPG: for triangles price kindly "stops" at each of the major swings for traders to take partial profits.
Hi, I get what you mean, if not sure, stay away. Taking this example as a learning trade, I am, confuse. Because the P is between support line at 1.9050 and a trendline resistance, my confusion starts: which is more important? The support line or the triangle?
The correct way is: "what price is doing (WPD)?".
If you understand it then you have to find "where price is going (WPG)"?
If you have *any* doubt about WPD you are way, way better skipping the trade completely.
Rule #1: capital preservation, and you can't fulfill it if you are not confident you have understood what the market is saying.
So, given the classic and FXGroup teachings say about triangles, WPD for me is: "price formed a triangle and broke it downwards. I expect price to retrace up to the triangle trend line to confirm...
Hi FxGroup, GBPNZD looks interesting. If it close above 1.9050, 1.9400 is the first TG. What you think?
Ignored
With the BEOB from 2 weeks ago we had an opportunity to take a short trade till the triangle's support.....now we are waiting for more informations at the S level.
We should watch carefull the P if it decides to turn back in the old RM.....are you reading chato ?...nice trade you made...and looking to the higher TFs....you know where and WHY to make MM !
Hi, I get what you mean, if not sure, stay away. Taking this example as a learning trade, I am, confuse. Because the P is between support line at 1.9050 and a trendline resistance, my confusion starts: which is more important? The support line or the triangle?
Ignored
What price is doing is the more important. If WPD is doing stuff through a triangle, then the triangle is more important because that's what price wants to play with.
But in the end that's for you to decide, where I see a triangle and plan my trade accordingly, you could see something else and you should plan accordingly. Well made plans will usually work somewhat, even if you did not "get" exactly what price was about to do, only when you don't make or respect a plan then you lose big time.