After a day of staying out of the market, the market seems to have incresed its potential for powerfull surges either way, but probabilities run higher for a strong surge upwards before anything happens on the downside. Very scary situation, but here is my view:
H8/M15
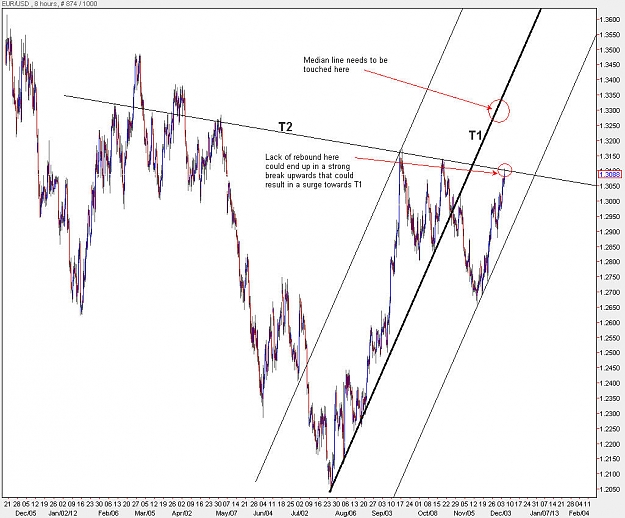
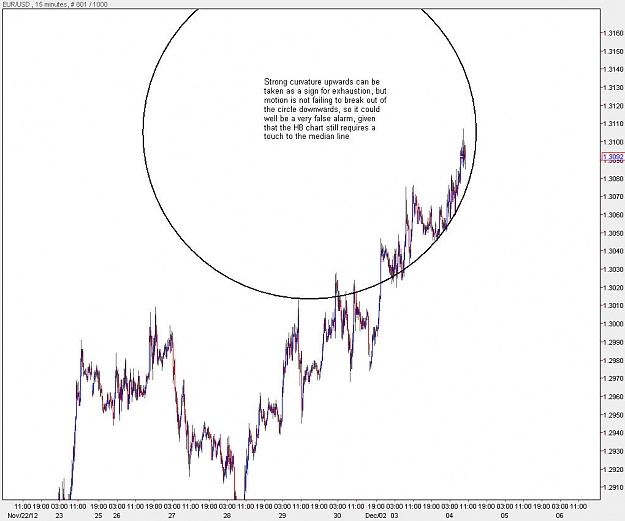
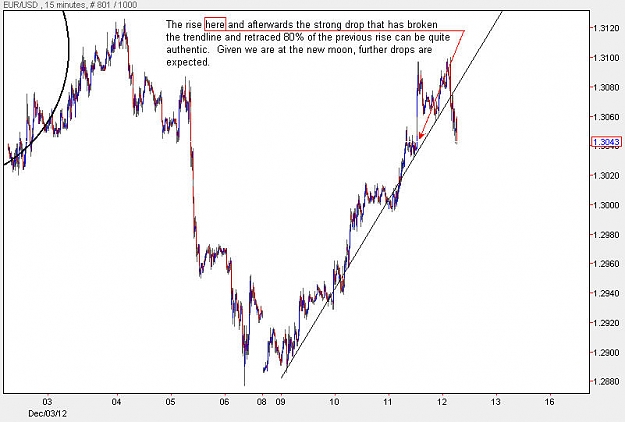
The sustenance of the EUR to penetrate the 3100 level is being tested, the median line, T1 has not been touched and there is no strong reaction downwards from T2. This only means a strong spike upwards towards T1. Although there is extreme curvature of movment on the lower time frames such as M15, but because the retracement off 3090 level has not been very much, chances for a spike upwards are high. If we see below 3080 at this moment, then whatever happens can take us easily below 2900 towards the 2500 region. Right now its at a very critical stage, and behaviour is the only measuring stick. The golden rule of trendlines is that
"If price action hesitates around a trendline 99% of the time it will break it"
We need a shooting star for a reversal, and to date we have not had one. This only presents one scenario and that is a strong surge towards the median line.
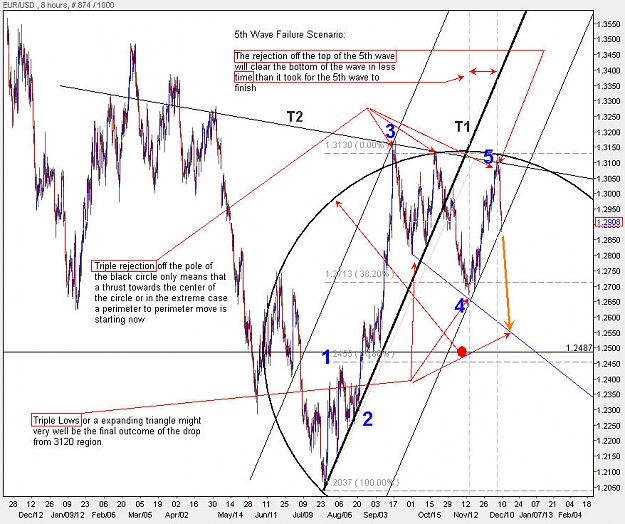
5th wave failure scenario in effect and in full motion after the rejection at 3120.
Continue shorting this pair until the blue line is reached.
In a 5th wave failure the rejection off the 5th wave will clear the bottom of the 5th wave in less time than it took for the 5th wave to form. Because of this we are looking at the lows of 2500, which also correspond to the 61.8 fib retracement of the entire rise from 2037.
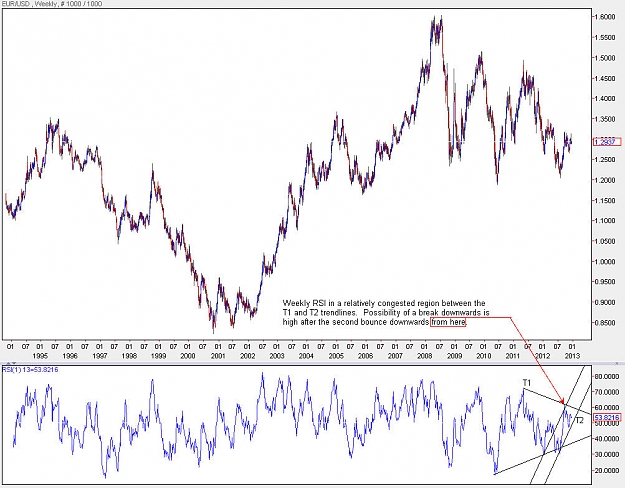
The 3000 level was the fork in the road which decided between higher highs of 3300/3400 and lower lows of 2400/2500. It was a very important stepping stone to the progress of this pair. Although the pair barely made it above 3100, it lacked sufficient momentum to go higher, and after 2 days of strong downfall and failing to go above the 3000 level it will continue its failure all the way untill it clears the low of 2662. This not only confirms how strong the T2 trendline is, but also emphasizes the strength of the T1 trendline on the weekly chart that was discussed before:
There is no visible sub divisions of the wave that has started from 3120 region 2 days ago, and the lack of such evidence only means that the drop is not done yet.
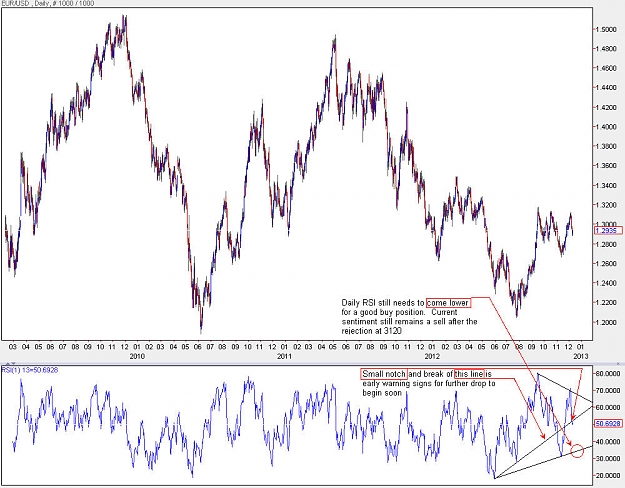
Weekly and Daily pointing to further down move that is yet to come. Current buy opportunity on the daily time frame has not materialized yet, and it will be few days before it happens.
At least till the new moon on December 13th.
Today will be a wipsaw day and better to stay out.
Today is 12-12-2012 a very special day that wont come up in a 1000 years
The EUR is still exhibiting a bearish behaviour.
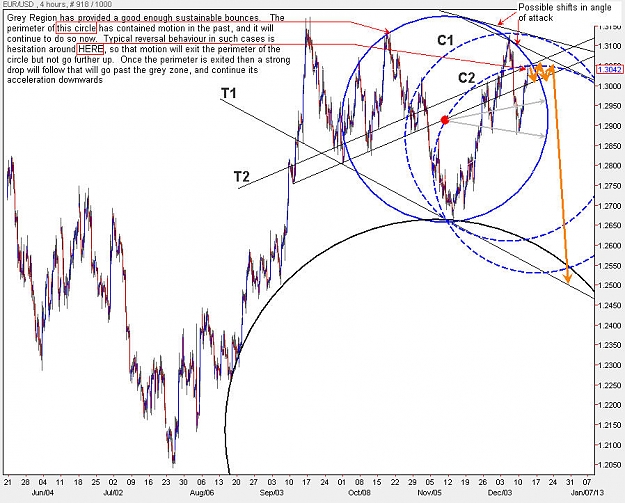
Through its action its currently completing the last cycle of efforts to break through the resistance imposed by the blue circle.
As time is progressing the probability of a triple low around the T1 trendline / black circle is increasing. The grey region of the solid blue circle has provided a good size bounce, but its perimeter has been a stronger resistance. The path of the motion could be shifting to obey the C1 or C2 circles, which then could create more angle shift to emphasize the early stages of a strong down draft to come.
Since the new moon is tomorrow, the probabilities are shifting more and more towards a strong sell anytime from now till +1 days after the new moon.
Further lows and a complete rejection of 3100 is in its early stages. Expectations are to soon drop below 3000.
Ignored
This is for you my friend
EgKid
Wish one of big banks or firms see this and if I'm wrong I Pay u and if I'm right Hire me But sometime only knowledge not enough but need LUCK
I have not been on this thread for 3 days for the simple reason of the fact that price action is breaking all levels of resistance without any problems and continues to soar defying all expectations.
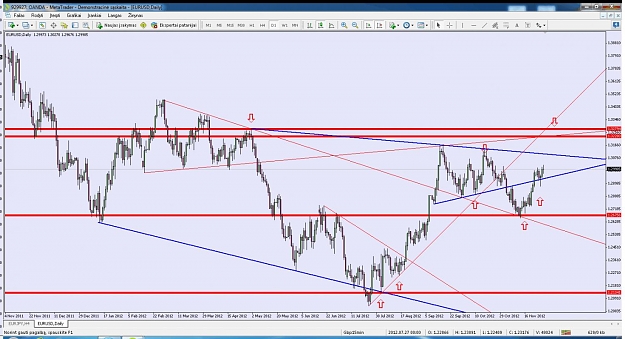
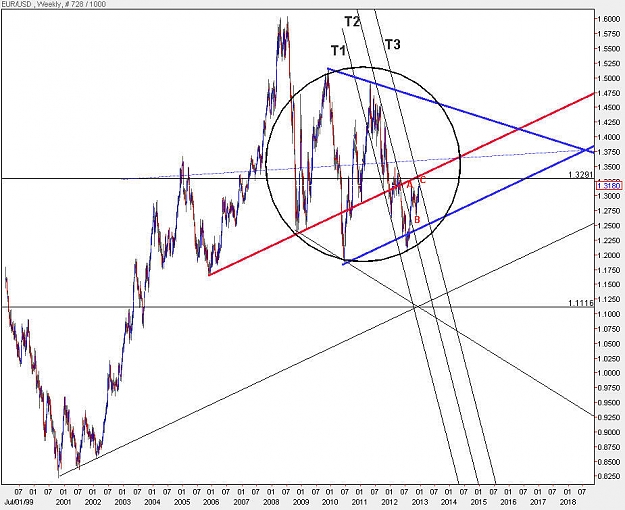
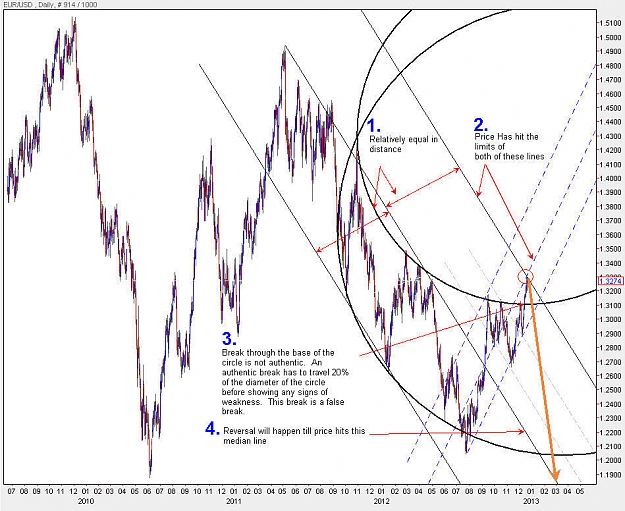
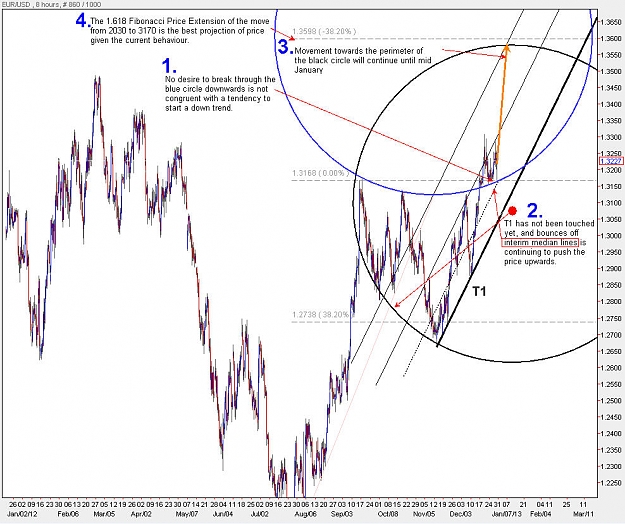
If upward motion continues the way it is now, on the weekly time frame the triangular region shown by the 2 blue lines will hold price action on a median line that passes through the apex. The location of this median line coincides with the red trendline which could be anywhere from the highs of 3280 to 3400.
There is also another warning sign on this time frame and that is the T1/T2/T3 trendlines. The break of the T2 trendline and temporary resistance at the T3 trendline is a behaviour that goes hand in hand with a strong explosion downwards. The move from T2 to T3 is what I call a "Trendline Shift", but not a "Trend Shift". This phenomenon usually happens in environments where constant expectations of a trend change are rising to the point that finally disappointment sets in, and at such moments the final explosion starts to happen. The explosion downwards on this time frame can go as far as 1.1116
The same atmosphere of uncertainty was created at the beginning of May 2012 where a switch in trend took place. The C wave which is now in progress is not a easy wave to trade, specially at this point in time where odd spikes in either direction can happen very quickly before the final direction becomes clear. The action in the last 3 days was not a promising action to indicate any trend change in the downward direction, and given the fact that we are close to the holiday season it adds another factor of uncertainty to the whole equation because there is not enough volume to generate any considerable force downwards, so basically much of the market is just moving on technicals.
In a uptrend one of the requirements for a trend change is a shooting star. So far the breakout from 3080 has not completed its "Shooting Star Path", which means there are more surprises yet to come in the upward direction, which translates to more upward movement. Going back to T1/T2/T3 the upward movment could also be considered a false break of T3.
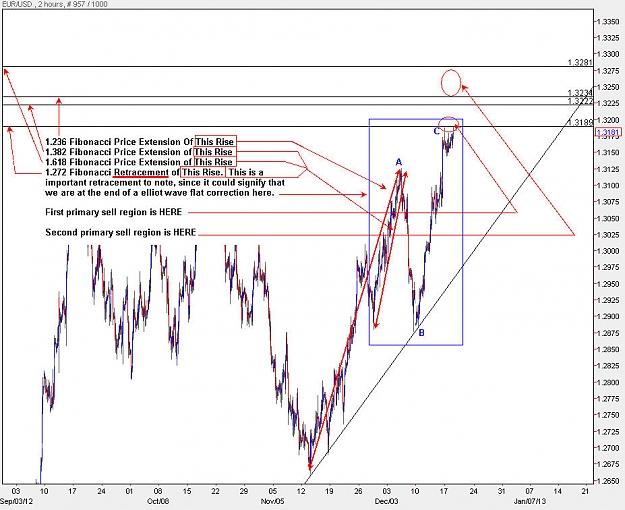
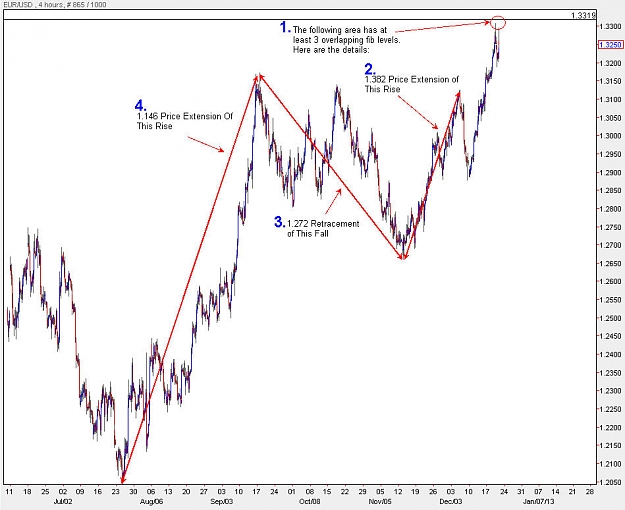
Because of such uncertainty in the current situation, the best indications right now are fibonacci price extensions, and retracements. The H2 chart has been marked with several levels, one of which is being hit at the moment. Any reversal will be bound by the T1 trendline on the H2 chart before another series of rises begin to happen.
Given the speed of advancement on this pair which is 150 pips a week, we need a stronger move sometime soon, and since we dont have a real market mover yet, your upward expectations of a strong move can start to materialize around the middle of January.
The middle of January is when we usually experience a strong market move.
The only other difference this year is the dooms day promise of Friday december 21st. If thats the case then the last spike upward should happen on Thursday night which coincides with the first quarter of the moon.
This is for you my friend
EgKid
Wish one of big banks or firms see this and if I'm wrong I Pay u and if I'm right Hire me But sometime only knowledge not enough but need LUCK
EUR is showing signs of weakness as it is approaching 3300, and is poised for a stronger than normal turn around, that will breach the low of 2000
Ignored
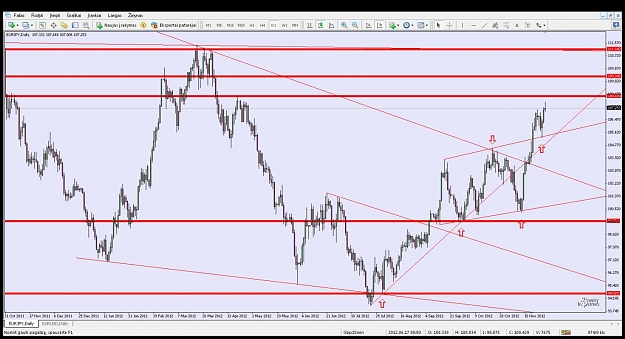
I can see this happening. As EUR/JPY seems to have hit the 61.8% retrace of the weekly down fib. This means that either E/U or U/J or both are poised to fall. With Shinzo Abe in office now in Japan and his proposal to weaken the Yen, it means that E/U will need to carry the brunt of the downmove. There are also many reasons on the E/U chart alone also, but I believe you have summarized a lot of those quite well.
I am crossing my fingers for this one to be it. Initially I thought after breaking the 3080 barrier that we might be up for a super impulse wave to take us much higher to above 3400 and more so around 3600. Thats around the 50% mark fibonacci retracement on the daily time frame from 4925 to 2030.
In that case most retracements should happen at the 1.618 price extension levels or at the 2.000 price extension levels. This one was not doing that, and the 100 pip drop yesterday was kind of suspicious in a super impulse wave case.
So thats what I came up few hours ago in deciding that this rise could be a false break of a curve, or a trendline shift.
I posted the fib levels in the EUR thread, which I am gonna do it here as well.
One thing is note worthy here, that this fall to below 2000 level one which I have been waiting for a long time for it, is going to be fast, but not smooth, because since 2005 on the weekly chart we have not had levels below 1.16 or 1.18 very often, so approaching 1.2000 will be quite a war there with lots of spikes in either direction.
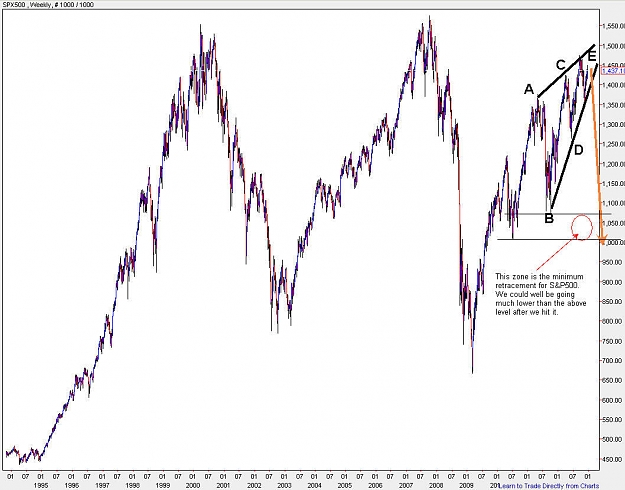
is gonna come true considering how bad the situation is in EUR is. The S&P500 chart has a big dip coming its way where the E wave of a triangle is getting completed. The thrust downward out of that triangle is going to be horrific, bringing everything down with it, including EUR/USD. They move in the same direction
I can see this happening. As EUR/JPY seems to have hit the 61.8% retrace of the weekly down fib. This means that either E/U or U/J or both are poised to fall. With Shinzo Abe in office now in Japan and his proposal to weaken the Yen, it means that E/U will need to carry the brunt of the downmove. There are also many reasons on the E/U chart alone also, but I believe you have summarized a lot of those quite well.
The situation for this pair remains unchanged from the previous forecast.
After hitting the fib levels on the H4 chart: http://www.forexfactory.com/showthre...64#post6312864
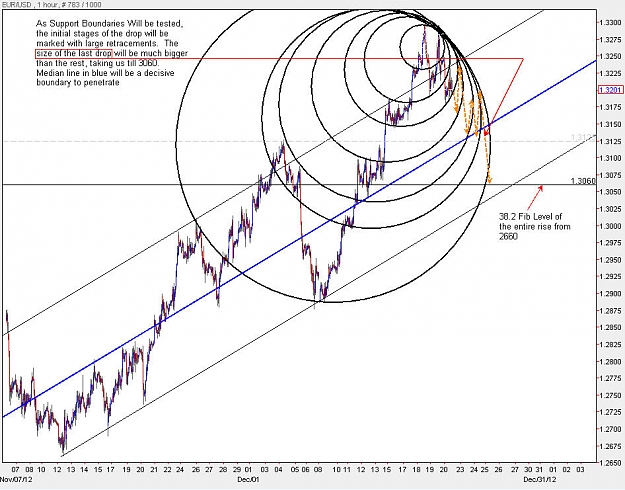
There is a expectancy of reversal happening on this time frame. The initial phase of retracements is going to go as far as 3060. This is the 38.2 fib retracement of the move from 2662 to 3308.
On the hourly chart the shell diagram of circles show the nature of the move.
Price action making a move to the Grey Zone of each circle, then dropping out of it to the next lower circle, and then making another retracement to the outer boundary of its previous support. The movement is shown by dotted orange arrows on the H1 chart.
As we get closer to the 3125 level, the nature of the drops will show more violent moves. This is because the gap between the next support and resistance will continue to increase.
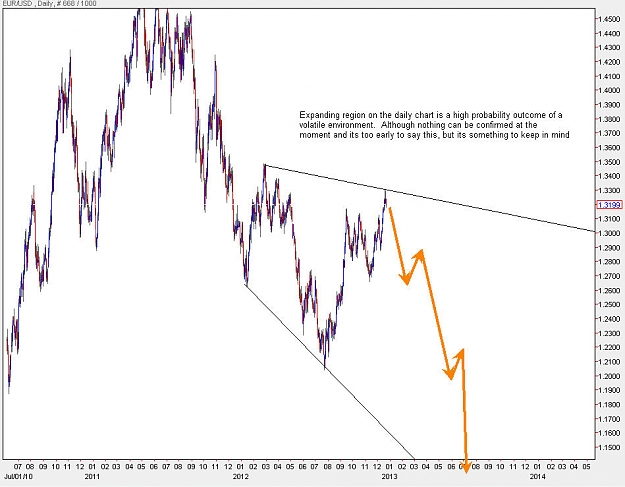
At the moment another structure of a expanding region has caught my attention on the daily chart, but its too soon to make a judgement about it. The only thing about these environments that show a common denominator is quick acceleration once the drop happens and lots of agitations with lower lows in its initial stages
Right now its holiday season and market will be moving mostly based on technicals, until the first/second week of january where there is a expectations of strong moves beginning then.
For now my current stance on this pair is to go short until 3060
I wont be on this thread after today until after "Boxing Day" (December 26th), but will post if anything significant happens.
Even though today is marked as "The End Of The World" in the Mayan Calendar, things wont change very significantly until after the holiday season, which has been the expected cycle for the past 10 years of this pair, so nothing out of the norm so far, and so much for the so called Ending Of The World.
Seeing the activity of this pair for the last 2 days, the last turnaround spot at 3309 will be breached soon. This pair has not yet reached the critical spot for a turnaround, simply because its finding strong support at the base of the blue circle, so that eliminates the false break scenario and also there is no strong surges that are moving towards T1. These behaviours eliminate the desire for this pair to make a come back to the 3000 level. Currently the best estimate for price is the fibonacci price extension of the move from 2030 which is around the highs of 3500 / Lows of 3600. Estimates would be for price to continue to soar after the new year and most probably around the midst of January we will experience a more probable spot for a turn around.
Seeing the activity of this pair for the last 2 days, the last turnaround spot at 3309 will be breached soon. This pair has not yet reached the critical spot for a turnaround, simply because its finding strong support at the base of the blue circle, so that eliminates the false break scenario and also there is no strong surges that are moving towards T1. These behaviours eliminate the desire for this pair to make a come back to the 3000 level. Currently the best estimate for price is the fibonacci price extension of the move...
Ignored
That's Almost what i said in previous post but for now waiting more drop to add Long
Already placed buy limit down there will tell when hit don't like rushing to tell now
Look to my circle in previous post
Happy weekend bro
After last week's rejection at 3300, I had to stay out for quite a bit of time to ponder more on what this pair is trying to do. So I had to go back to the drawing board and draw my timelines to see what is happening.
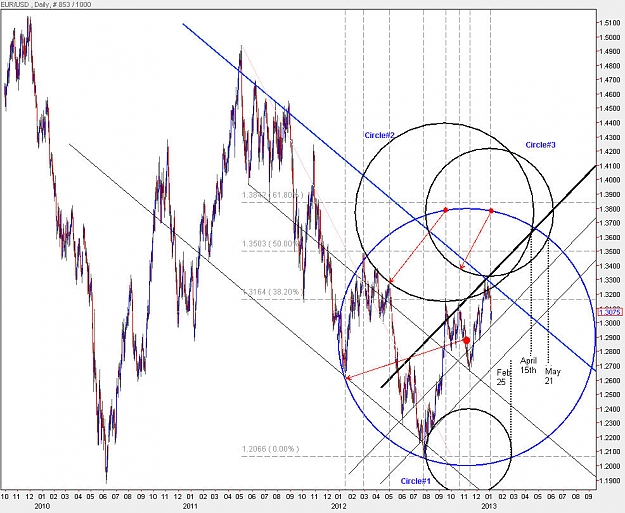
In short the EUR will continue to soar until it gets to 3800 by middle of this year, probably around end of may/early june, that is what the 3rd circle (Circle#3) in my drawing is telling me from a time frame perspective.
Combining the 3rd circle with the desire of this pair to continuously challenge the 38.2 retracement of 4945-2060 is only showing that this pair will go to at least the 61.8 retracement of the mentioned fall which is around the 3850 level.
3 timelines are very important
February 25
April 15
May 21
January 1st to February 25 = 56 days
February 25 to April 15th = 48 days
April 15th to May 21 = 36 days
Because of tripple rejection at 3300 between December 19th to January 1st the cycle of the movement will most probably fall within the following patterns:
January 1st to February 25, the pair will descend to either a tripple low at 2450 or to 2650 level. The sell pressure was being heavily fought at 3300 and was building up, so it will be some time before the market is satisfied that the pressure has diminished and decides to go up. Something very interesting about this cycle is that it starts 3 days after the full moon on December 28th 2012 and will last 2 full moons up and until February 25th where the last full moon will happen. Look for relative highs around the new moon.
The low will be hit around February 25th close to the full moon, after that it will starts its rise towards 3800
After February 25 we will start a new series of rises towards 3800 that will most probably be a ascend till half way time between Febrary 25 to April 15 and then a descnd again, but the low of February 25 will not be breached and 3800 will not be reached within this time frame
April 15th - May 21 will be the last series of struggles to finally achieve a top at around 3850 and will be the quickest move out of all the time frames
After this we might very well start to see a decend that will go below 2000.
So right now the situation is to sell at any new highs until at least 2600 and most probably 2450.
First sell spot is the 38.2 retracement of the drop from 3300 to 3000 which is roughly the 3135 level.