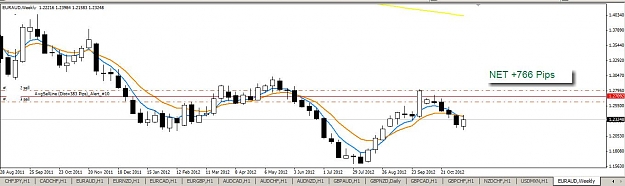
Forex Factory
  • Login

  • Username: Password:
  • 1:40am

  • Search
  • Home

  • Forums

  • Trades

  • Calendar

  • News

  • Market

  • Brokers

Options

Search
Search
Search

Subscribe to Thread

Bookmark Thread

First Page First Unread Last Page Last Post

Printable Version

Similar Threads

Weekly Millipede Idea 79 replies

Build an Equity Millipede with the filtered Flying Buddha 171 replies

GBP/JPY Equity Building Profitable trading strategies 40 replies

Application Development - Journal of Building an equity millipede 14 replies

Need Help building an EA 9 replies

  • Trading Systems
  • /
  • Reply to Thread
  • 860

Building an equity millipede

  • Last Post
  • First Unread
  •  
  • 1 271272Page 273274275 296
  •  
  • Post# 5,441
  • Quote
  • Nov 15, 2012 11:49am
  • timos
    Joined Sep 2012 | 51 Posts | Status: Member
4 positions stacked at aud/chf 2 currently at be.
Price is going down and is just 50 pips away from 200 sma,H4. I think this is good point to watch,if price goes below 200 sma,there may be lot of pips to be made.

Regards
Tim
Attached Image (click to enlarge)
Click to Enlarge

Name: 15-11-2012 6-45-27 aud chf.jpg
Size: 298 KB
  • Post# 5,442
  • Quote
  • Nov 15, 2012 11:53am
  • zusch
    Joined Feb 2011 | 392 Posts | Status: Trade the hot hand.
Quoting VEEFX
Got clobbered last night with the upward spike in E/A during London session. I had 1580+ pips across 6 short positions and just a 100 pip move reduced my floating pips to 1200 pips closing 2 legs at BE. Just closed 2 legs this morning and left two of the largest legs.

Moves like this are the biggest downside of this trading approach as a small reversal could wipe out days/weeks of position building. One has to truly believe in the full potential of this method and have nerves of steel to see 5-10+% of their floating equity reduce to ashes!...
Lower timeframes were giving some hints that the streak of 10 down days in a row could get snapped, but really monthly/weekly/daily were all still saying sell and its not our job to predict when that streak will get snapped. Good job taking two positions off the table when you did. Monthly chart is still on your side for your two remaining positions, but the bulls are following up yesterday very strongly and now the weekly chart is looking bullish. I've attached the 4hr chart showing those hints. I've also sent you a private message and I hope to hear from you!
Attached Image (click to enlarge)
Click to Enlarge

Name: 11.15.12 EURAUD 4HR.png
Size: 24 KB
Twitter: @zusch_fx -- Preselecting trending pairs on a weekly basis.
  • Post# 5,443
  • Quote
  • Nov 16, 2012 11:33am
  • Tortoise22
    Joined May 2012 | 1 Post | Status: Member
Hi, This will be my first post on this forum but I have been lurking around for over a year now. I have been avidly reading this thread and have started to build a short leg on aud/usd in the hope that the long term uptrend is ripe for a reversal. I hope that the current drop will continue at least down to the bottom TL of the triangle on the weekly chart.

I know that triangle patterns are usually a sign of continuation of the main trend and so will not be surprised if this is the final leg down and we then see a continue of the bullish trend up and past the highs.

The reason for my post is to ask about diversification as although I have not got that far yet (my legs not mature enough to even consider diversification) I know this is something that people seem to be struggling with. It seems to be the one part of Graemes method that is the hardest for people to crack.

I am wondering if this is largely dependent on where you are in the world geographically. I am from the UK and use FXCM as my broker. I have no problem in placing buy and sell positions in any direction and there is no aggregation of orders either.

I notice Graeme is from Austrialia and uses FXCM whereas many of you seem to be from the US with no hedging allowed on the same account. I am wondering if this is why diversification is proving so difficult?

I can relate to Graemes 'going with the flow of the market' and although I haven't started diversifying yet on my live account, experiments on demo suggests to me that it is not as onerous as you are finding it IF you can run the positions on the basis I can in my UK account. In fact in some respects it is quite nice to place an opposing position to your main leg (obviously at a relatively low risk opportunity) as you have the protection of all the open positions from your main leg to buffer any losses/drawdown should the market move against you.

I do think diversification is the real key to the method as it does truely allow you to let the market decide and take away any angst if market conditions change unexpectedly.

Apologies if this has been discussed at length before but I would be interested in your views.
  • Post# 5,444
  • Quote
  • Nov 16, 2012 5:40pm
  • VEEFX
    Joined Jun 2006 | 662 Posts | Status: Member
Quoting zusch
Lower timeframes were giving some hints that the streak of 10 down days in a row could get snapped, but really monthly/weekly/daily were all still saying sell and its not our job to predict when that streak will get snapped. Good job taking two positions off the table when you did. Monthly chart is still on your side for your two remaining positions, but the bulls are following up yesterday very strongly and now the weekly chart is looking bullish. I've attached the 4hr chart showing those hints. I've also sent you a private message...
Sure Zusch. Interesting how trader's anticipation varies :-

Weekly Chart was never looking bullish imho as price bounced near last week's open price. I personally never factor the current candle in medium/long term trend analysis. Current candle (i.e. wick formation) is used only in entries as described in numerous wick interpretation posts by Graeme.
Attached Image (click to enlarge)
Click to Enlarge

Name: Snap1039.jpg
Size: 75 KB
Best Regards, - Vee (I delete most of my posts within 24 hours)
  • Post# 5,445
  • Quote
  • Nov 16, 2012 7:43pm
  • zusch
    Joined Feb 2011 | 392 Posts | Status: Trade the hot hand.
Quoting VEEFX
Sure Zusch. Interesting how trader's anticipation varies :-

Weekly Chart was never looking bullish imho as price bounced near last week's open price. I personally never factor the current candle in medium/long term trend analysis. Current candle (i.e. wick formation) is used only in entries as described in numerous wick interpretation posts by Graeme.
Could you explain what you mean by this? I don't quite understand.

I think weekly chart is bullish now simply because its green and it retraced over nearly all of last weeks range. I consider a retrace past 61.8% of previous candle a possible reversal sign like Graeme mentions in post 965.

However, monthly hindsight of down is still valid until the month closes so next week has a good chance to continue the trend down. There is a long bottom wick on the current monthly candle and if the monthly candle were to close as it is now, that would just be a weird candle to follow up last months pinbar.

To summarize weekly and monthly are giving conflicting signals to me. One will eventually win out (usually higher timeframe wins). Graeme talks about this in post 2012.
Twitter: @zusch_fx -- Preselecting trending pairs on a weekly basis.
  • Post# 5,446
  • Quote
  • Nov 17, 2012 2:15am
  • VEEFX
    Joined Jun 2006 | 662 Posts | Status: Member
Quoting zusch
Could you explain what you mean by this? I don't quite understand.

I think weekly chart is bullish now simply because its green and it retraced over nearly all of last weeks range. I consider a retrace past 61.8% of previous candle a possible reversal sign like Graeme mentions in post 965.

However, monthly hindsight of down is still valid until the month closes so next week has a good chance to continue the trend down. There is a long bottom wick on the current...
My apologies zusch if I was not clear. By Long Term Trend Analysis, I mean hindsight analysis on weekly/monthly. I believe you are referring to anticipation in regards to making entries based on how the current weekly candle formation in relation to previous week's candle. Your understanding is spot on.... it is ok to enter a probe in long direction with anticipation that the current weekly candle could become a game changer (trend reversal based on tip of wick interpretation at FIB levels etc). I would also do the same but I would NOT change my weekly hindsight based on the current open candle formation. I analyze all my chosen pairs on weekends to form a weekly/monthly hindsight based on numerous factors mentioned by Graeme. Once a Hindsight is formed, I stick to my hindsight until the end of current week/month.

The concept of hindsight should be similar to a trendline break. Would you consider a change in trend if price breaks out of weekly trendline by 50 or 100 pips? Weekly candle should close above/below the trendline to qualify for a trend reversal (assuming one knows how to correctly draw trendlines!)

I did try a couple of short probes on Thursday as the tip of wick was approaching 33% and 50% ending one in loss and one at BE. I forced myself to stay away from this pair on Friday due to two failed probes. This is where discipline comes into play. I have to listen to what market is conveying and limit my losses (milk the heck out when market conditions are favorable)... which is key for this trading method.

Looking ahead into my weekend's hindsight analysis for next week, I would wait for this pair to show clear direction next week as the upper and lower wick is almost the same size (buyers starring as sellers analogy used by Graeme with buyers winning first and then sellers winning). If Monday closes above the open of last week's candle with compelling momentum, I might consider going long. If Monday is a down day, then I would consider it as a confirmation for a weekly downtrend and continue stacking short positions.

Looking at my portfolio, I am overexposed on AUD, so I might just stay flat for now and focus on JPY weakness. Remainder of the year will be a very tough trading environment with random news from politicians causing significant volatility. In such unpredictable trading environment, it is better to trade near breakout/bounce of highs/lows of D1/WK/MN candles. Any level within the body will be a hit or miss.

Hope this clarifies.
Best Regards, - Vee (I delete most of my posts within 24 hours)
  • Post# 5,447
  • Quote
  • Nov 20, 2012 5:45am
  • henry.deng
    Joined Nov 2012 | 1 Post | Status: Junior Member
Very good, thanks.
  • Post# 5,448
  • Quote
  • Nov 23, 2012 4:10am
  • miekra
    Joined Feb 2010 | 25 Posts | Status: Member
Quoting SABTrader
Here's a custom indicator for MT4 to show the proximity of price to the 200 ema.
When price is within 40 pips a box appears on the lhs of the chart.
The height of the box is 40 pips to give some perspective to the chart volatility.
If price is below the ema, the top of the box is at the same level as the current ema level and it's color is red.
If price is above the ema, the bottom of the box is at the same level as the ema and it's color is green.

There is a user input for repaint
when true it updates with each tick.
when false it only updates...
HI Steve,

Many tks for this very useful indi.

Could you pls be so kind and look at the code as I got following msg during compilation inMT4:
errors(0), warnings(1)
Function "Get_sPeriod" is not referenced and will be removed from exp-file

Have a nice day
Mike
  • Post# 5,449
  • Quote
  • Nov 23, 2012 7:50pm
  • tokyotrader
    Joined Mar 2011 | 14 Posts | Status: Member
Hello Graeme,

I am following the weekly eur/usd. I have put two trendlines on my chart and you can see that over a long period it has been moving down with many upturns also. Right now the weekly candle is bullish but if the movement on my chart holds then next week it should turn back to a bearish candle, of course nothing is guaranteed but like you said the direction it moves in usually stays the same.

Currently I am in a losing sell trade, I am trying to follow your method for entries and use the weekly as my guide,
Thank you
  • Post# 5,450
  • Quote
  • Nov 25, 2012 4:10am
  • cameron1st
    Joined Aug 2010 | 217 Posts | Status: lex parsimoniae
Hi tokyotrader,

Nobody knows what the market will do next, and there is a tendency for people having an open short position to see more arguments of why the market would go lower than higher.

Hopefully the risk you are taking on is part of a plan established before-hand and not only based on hope that the next week should turn into a bearish candle.

Regards,

Cam
  • Post# 5,451
  • Quote
  • Nov 25, 2012 2:19pm | Edited at 3:09pm
  • VEEFX
    Joined Jun 2006 | 662 Posts | Status: Member
Quoting cameron1st
Hi tokyotrader,

Nobody knows what the market will do next, and there is a tendency for people having an open short position to see more arguments of why the market would go lower than higher.

Hopefully the risk you are taking on is part of a plan established before-hand and not only based on hope that the next week should turn into a bearish candle.

Regards,

Cam
Welcome back Cam. Glad to see you come out of hibernation and share your wisdom :-

Just to add a bit more.... this is a downside to most trading platforms that allow trading from charts. Most of them display open orders on charts which affects your ability to keep an open mind on change in direction. Our mind strives to be right from actions taken in the past hence they look at their open positions and continue to find reasons to justify the chosen direction instead of going with the flow.

Here's what I do to 'reset' my mindset on direction. During weekend hindsight analysis when preparing for next week, I try to clear my mind from how price reacted to my chart studies in the past. I hide them using the attached script to reset objectivity/subjectivity/bias I have formed watching the pair. I also run this script just before opening positions most times (with a hotkey) to keep my emotions in check and not get disappointed if my anticipation does not work out in my favor. It also helps as a reminder that market is out of our control no matter how much we analyze. Seeing a completely naked chart frequently helps me stay neutral at all times with an open mind to just follow the price.

Hope this helps.

P.S. I found this script here on FF so many thanks to the author who wrote it. Unfortunately, it does NOT hide open positions on the chart. If anyone here can find the MQ4 version and modify this script to completely hide open positions form chart, that would be awesome!!!!

Edit: I also ran into this article http://thesensibleguidetoforex.com/2...subscribe-blog. Just a glimpse for tokyotrader why you should be concerned keeping a losing position open during the weekend. I closed out some positions on Friday which were under 30-40pips close to my BE. SL/BE orders are just useless during weekend gaps!!!
Attached File
File Type: ex4 TradeNaked (show or hide objects on charts by JoshDance).ex4   2 KB | 122 downloads
Best Regards, - Vee (I delete most of my posts within 24 hours)
  • Post# 5,452
  • Quote
  • Nov 25, 2012 5:31pm
  • cameron1st
    Joined Aug 2010 | 217 Posts | Status: lex parsimoniae
Thank you Vee, I haven't left, just that there is not much I can add to the on-going discussions, or to what Graeme taught us.

EURUSD Weekly chart attached... for me it's up, there was a correction, positively ended with that bullish run last week (closed above the open of the latest bearish week). My long positions are thriving and my shorts are getting closed at be, meaning that for the time being we are going up.
Attached Image (click to enlarge)
Click to Enlarge

Name: Capture.JPG
Size: 68 KB
  • Post# 5,453
  • Quote
  • Nov 27, 2012 11:48am
  • VEEFX
    Joined Jun 2006 | 662 Posts | Status: Member
Quoting cameron1st
Thank you Vee, I haven't left, just that there is not much I can add to the on-going discussions, or to what Graeme taught us.

EURUSD Weekly chart attached... for me it's up, there was a correction, positively ended with that bullish run last week (closed above the open of the latest bearish week). My long positions are thriving and my shorts are getting closed at be, meaning that for the time being we are going up.
Fantastic position building effort Cam. It is great to share such experiences. Curious if you could share further stats/details. For me, I would really like to know how much is your floating profit on E/U as % of account balance. I have experienced 40%-50% floating equity growth after which it gets super tough. I have overcome the hurdle of small realized losses though... in fact, I just love to see them in my account history and feel quite proud :-

For E/U, it is long for sure but a bit concern about the strong resistance at 1.30 along with coinciding downward trend line on weekly and monthly TF. I will be probing a few shorts if I see another down day on this pair. Fundamentally, I still feel this pair is short for December with all the crap that is going on in DC, Greece and Spain. Some loser says something in a press release and this pair goes all crazy on me :-!
Best Regards, - Vee (I delete most of my posts within 24 hours)
  • Post# 5,454
  • Quote
  • Nov 27, 2012 5:09pm
  • cameron1st
    Joined Aug 2010 | 217 Posts | Status: lex parsimoniae
Quoting VEEFX
Fantastic position building effort Cam. It is great to share such experiences. Curious if you could share further stats/details. For me, I would really like to know how much is your floating profit on E/U as % of account balance. I have experienced 40%-50% floating equity growth after which it gets super tough. I have overcome the hurdle of small realized losses though... in fact, I just love to see them in my account history and feel quite proud :-
Hi Vee,

Thank you, I thought your millipede was very impressive as well.

All my open positions are worth 2.8 times the account balance in this moment; my stats are very simple, mainly related to entries, how many wins, losses, break-even, and I keep how many realised Rs (as in R:R) I am in profit since I started this account.

What works best for me is to just turn my brain off ... I have spent thousands of hours trading and when I had wins (meaning, when the trend would continue after I entered and price did not come back to my entry for a while), I analysed them closely ... what was the market doing, how was the Weekly chart ? what about Daily ? ... down to the 5 minutes chart... what was the trend ? and everything else I could consider about a setup. So then in my mind there was a pattern forming, I could pick it without doing any thinking (it would look completely random to someone else and I would not be able to put it in words).

Everyone has to find their own pattern that they can recognise and trade, and that's their individual edge, and nobody else can give you that.

Also, aim for longevity, trade a size that is allowing you to lose ad nauseum and not get broke. Currently my win+be rate is alright, but it was really bad in the beginning, just keep at it, might take years to profit.

As you noticed by now, I avoided giving too many specific details because they are irrelevant to you. You have your own stats, aim to improve those, do not concern your mind with details about my or other trader's trading, it will only delay your success... you know how to trade, keep at it.

Cheers,

Cam
  • Post# 5,455
  • Quote
  • Dec 1, 2012 10:03am
  • fxpig
    Joined Jul 2006 | 35 Posts | Status: Member
To All Members;

Please help, how could I get easy to read charts from these pictures? Thank you in advance.

fxpig


Quoting pipEASY
Why entering 2 positions is effective

EURUSD 4HR


Look at next example, and see the benefit of entering at .00 with 2 positions

EURUSD 4HR
  • Post# 5,456
  • Quote
  • Dec 1, 2012 6:38pm
  • timos
    Joined Sep 2012 | 51 Posts | Status: Member
Quoting fxpig
To All Members;

Please help, how could I get easy to read charts from these pictures? Thank you in advance.

fxpig
Read all PipEasy posts from the begining of this thread.
  • Post# 5,457
  • Quote
  • Dec 1, 2012 9:59pm | Edited at 10:09pm
  • fxpig
    Joined Jul 2006 | 35 Posts | Status: Member
Quoting timos
Read all PipEasy posts from the begining of this thread.
Hi timos,

Many thanks for your reply, however what process could I do making those charts clearer and easy to read?
As you knew there are many of them. These are only two samples.
  • Post# 5,458
  • Quote
  • Dec 2, 2012 3:00pm
  • timos
    Joined Sep 2012 | 51 Posts | Status: Member
Quoting fxpig
Hi timos,

Many thanks for your reply, however what process could I do making those charts clearer and easy to read?
As you knew there are many of them. These are only two samples.
There are lot of examples,some of them are have not the best quality but you can still read them.Check the thread from the beginning.
  • Post# 5,459
  • Quote
  • Dec 2, 2012 7:58pm
  • scalpz
    Joined Oct 2008 | 426 Posts | Status: Target 1: SL in the green
Quoting fxpig
Hi timos,

Many thanks for your reply, however what process could I do making those charts clearer and easy to read?
As you knew there are many of them. These are only two samples.
Unfortunately imageshack is free for a reason (along with its damb popup attempts). The file size is small and therefore not very good pictures emerge, even if you zoom in on the original pic displayed by imageshack.

I saved some screens to my computer then open them with Microsoft Office Picture Manager. It seems to have a little better zoom.

Also used Windows Photo Gallery for some pictures.

To swap between the 2 I right click on the filename in explorer and change it via the Properties > General > Change tabs & buttons.
This does change all of the xxx.png files until altered back - Good luck

I suppose there is a way to change the default program to open the picture directly from the forum, but havent worked on it.

cheers scalpz
Target 2 : Stoploss in the green
  • Post# 5,460
  • Quote
  • Dec 2, 2012 9:43pm
  • VEEFX
    Joined Jun 2006 | 662 Posts | Status: Member
Quoting scalpz
Unfortunately imageshack is free for a reason (along with its damb popup attempts). The file size is small and therefore not very good pictures emerge, even if you zoom in on the original pic displayed by imageshack.

I saved some screens to my computer then open them with Microsoft Office Picture Manager. It seems to have a little better zoom.

Also used Windows Photo Gallery for some pictures.

To swap between the 2 I right click on the filename in explorer and change it via the Properties > General > Change tabs & buttons.
This does...
It is amazing how one chooses to complicate their lives and the other doesn't want to spend a few minutes thinking out of the box

Step1: Go here... http://www.forexfactory.com/showthre...85#post5105285. Folks just like to ask questions rather that using the paperclick feature to pull up all attachments on the thread!
Step2: Download and open the zip file. I put all the posts made just by Graeme in the zip file to help new readers.
Step3: Open the html in IE browser by doubleclicking on the html file
Step4: Do a "File > Save As" and save the file with file type of "webpage, complete(*.htm, *.html)". This step will create a htm file along with all the images in a folder ending with "_files"
Step5: Repeat step 3 and 4 for all the files in the zip file

You now have ALL the gazilion images from Graeme on your local hard drive !!!! Doubleclick will bring up images in Microsoft photo gallery on vista.

Having said the above, simply using the zooming feature in IE or Safari will do the trick. Heck, if I can use these html files on my android smartphone, it is certainly viewable on your computer!
Best Regards, - Vee (I delete most of my posts within 24 hours)
Thread Tools Search this Thread
Show Printable Version Show Printable Version
Email This Thread Email This Thread
Search this Thread:

Advanced Search

  • Trading Systems
  • /
  • Building an equity millipede
  • Reply to Thread
    • 1 271272Page 273274275 296
1 trader viewing now
  • More

©2013 Forex Factory, Inc. / Terms of Use / Privacy Policy

Forex Factory® is a registered trademark.

Connect

  • Facebook
  • Twitter
  • RSS

Company

  • About FF
  • FF Blog
  • Careers at FF
  • Advertising
  • Contact FF

Products

  • Forums
  • Trades
  • Calendar
  • News
  • Market
  • Brokers
  • Trade Explorer

Website

  • Homepage
  • Search
  • User Guide
  • Member List
  • Online Now
  • Report a Bug