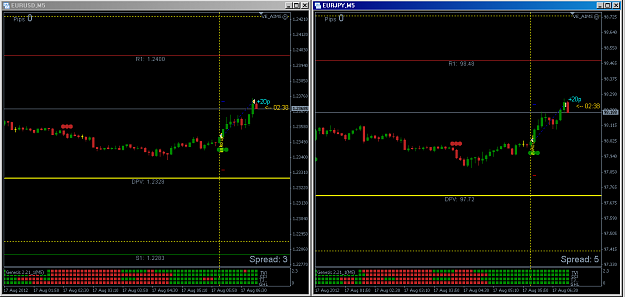
DislikedDon't worry, mine are still moving nicely. This is the ATR indie I prefer, you can't change any of the inputs except the colour (which you'll need to do if you have a black chart) If you hover over the lines, you will see when the day starts that above the price is high 2 then above that high1 then below price you have low 2 and low 1 in that order. When price reaches one of the lines for instance, on EJ now, price has reached and gone through Low 2 and Low 1, it then brings the High lines down to show where (if it now turns around) price...
Ignored
As we know its calculated on average range from last period.
Thanks to Cody, we know that “lfl-atr projections” is using an averaging of last 7 days.
The problem could be with calculation because of different time of brokers servers.
Instead of 5 normal daily candles per week we can have 6 candles.
So sixth candle is significally decreasing an average true range.
Also as we know new day at the market starts with Sydney.
And if your brokers starts much more later after Sydney it is also can influence on exact ATR number.
So, to get as much as more real ATR numbers we have to use broker with 5 daily candles per week and we have to be able to adjust starting time for ATR calculation.
It’s all my thoughts about ATR and may be I am wrong, just want to share it.
By the way, good explanation video about “lfl-atr projections”:
Inserted Video
Everything is possible!!! Step by Step...